Author: SectoJoy

  • Creating Electronic Resumes: How to Perfectly Convert Word to PDF (2026)

    Creating Electronic Resumes: How to Perfectly Convert Word to PDF (2026)

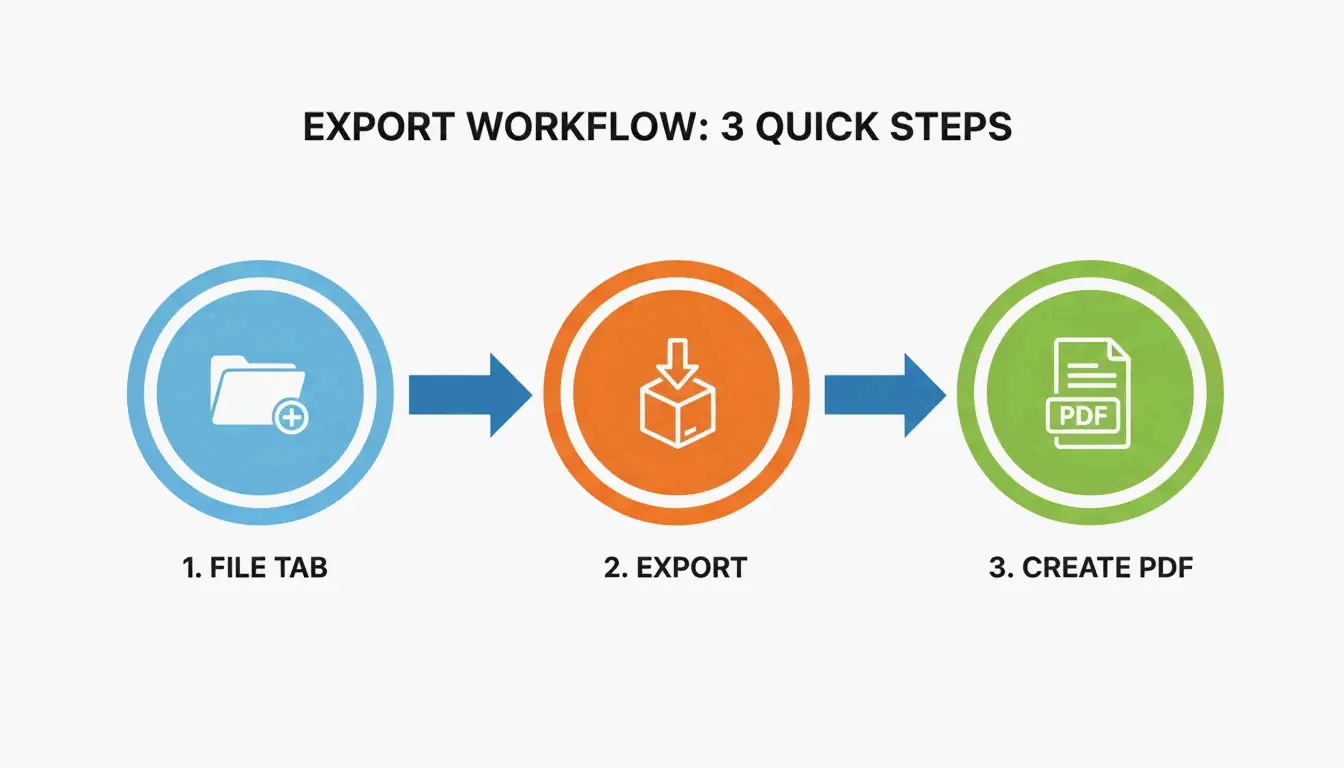
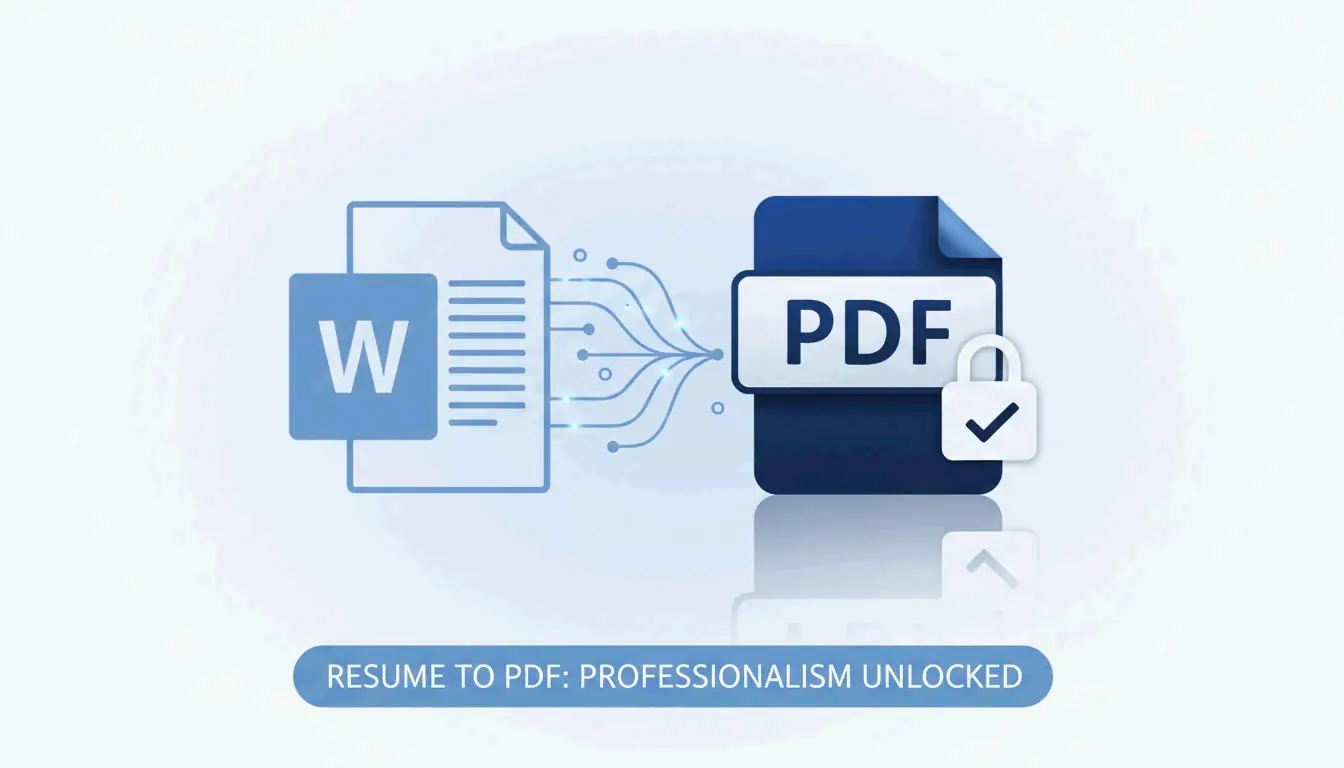
    To convert a Word resume to PDF, open the document in Microsoft Word → File → Export → Create PDF/XPS. Select “Standard (publishing online and printing)” for best quality. This preserves formatting, keeps hyperlinks active, and ensures ATS readability.

    Word to PDF: 6-Step Export

    Step Action Why
    1 Open final draft in Microsoft Word Use your master .docx file
    2 Click File tab Top-left corner
    3 Select Export (or Save As) Both paths work
    4 Choose PDF (*.pdf) format From dropdown
    5 Select “Standard” optimization Preserves metadata + hyperlinks
    6 Click Publish Done

    A simple 3-step visualization of the Word-to-PDF export process.

    Critical: Use Export or Save As — never “Print to PDF”, which flattens hyperlinks and can alter layout.

    Why PDF Over DOCX for Resumes

    Factor DOCX PDF
    Formatting consistency Varies by device/software Locked — identical everywhere
    Font rendering Depends on installed fonts Embedded in file
    Spell-check lines Red/blue squiggles visible Removed — clean output
    Hyperlinks Active Active (via Export)
    ATS readability Good Good (if text-based)
    File tampering Easy to edit Locked

    Doroteya Vasileva, CPRW at Enhancv confirms PDFs eliminate formatting drift and spell-check artifacts.

    ATS Compatibility: The 5-Second Test

    Modern ATS reads text-based PDFs without issue. Verify with this quick test:

    1. Open your PDF
    2. Highlight a sentence with your mouse
    3. Copy the text
    4. Paste into Notepad (Windows) or TextEdit (Mac)
    Result Meaning ATS Status
    Readable text Text-based PDF Pass — ATS-friendly
    Gibberish / symbols Encoding issues Fail — fix source document
    Can’t select text Image-based PDF Fail — ATS will reject

    Per Enhancv, keep margins at 0.5–1.0 inch to prevent ATS from clipping edge text.
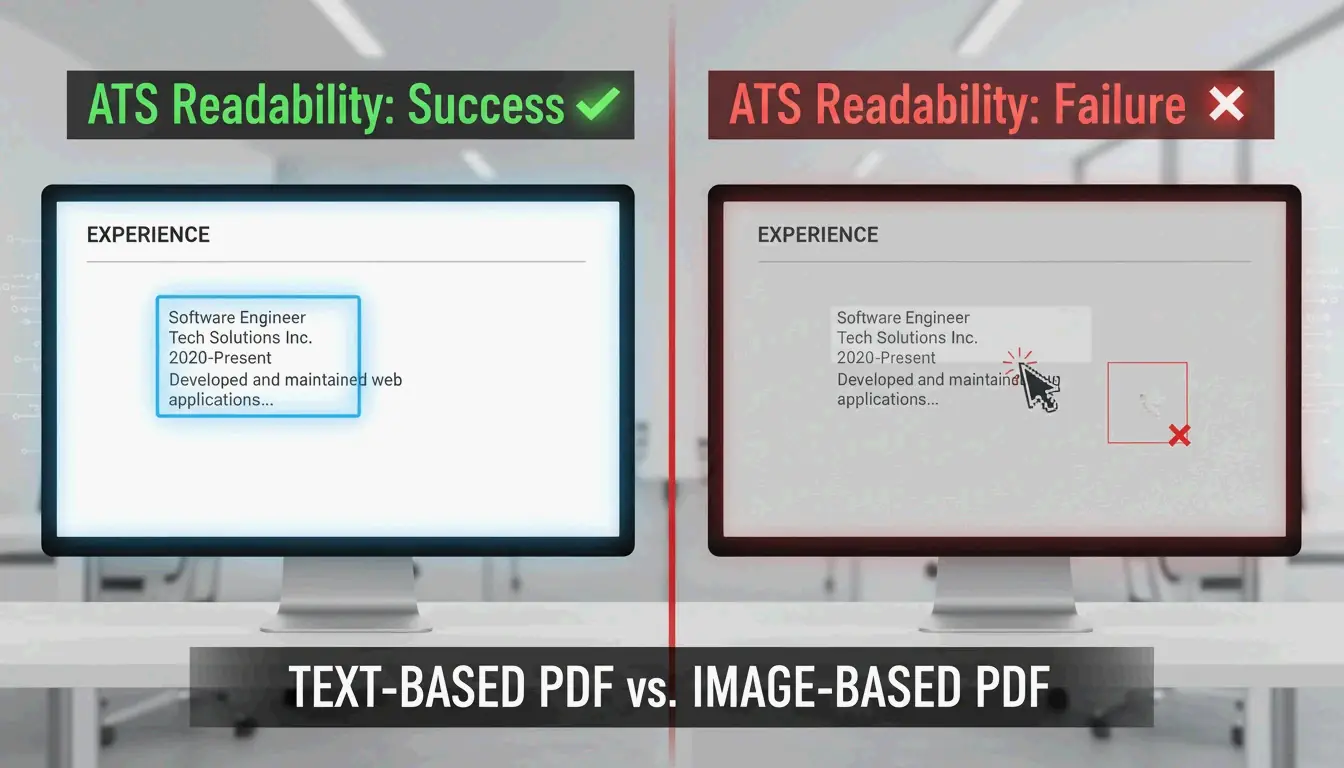
    A visual metaphor for 'Readability'—comparing clear text vs. unreadable image data.

    Export Method Comparison

    Method Hyperlinks Layout Accuracy ATS Readable
    File → Export Preserved High Yes
    File → Save As PDF Preserved High Yes
    Print to PDF Lost May shift Possibly
    Online converter Varies Varies Varies

    Always use Export or Save As — never Print to PDF.

    Alternative Tools

    Tool Best For Limitation
    Microsoft Word (desktop) Full control, hyperlinks Requires license
    Google Docs (File → Download → PDF) Free, basic resumes Complex layouts may break per IBTimes UK
    pdfFiller Batch conversion, eSignatures 12,500+ G2/Capterra reviews
    Adobe Acrobat DC PDF editing, password protection Paid

    Mobile Rendering Check

    Recruiters often scan resumes on phones. Before submitting:

    1. Email the PDF to yourself
    2. Open on your phone in Adobe Acrobat DC or default viewer
    3. Verify: font readable, text boxes intact, no layout collapse
    4. Test hyperlinks: LinkedIn, portfolio links still clickable

    Resume Formatting Best Practices

    Setting Recommendation
    Margins 0.5–1.0 inch (prevents ATS clipping)
    Fonts Standard system fonts (Arial, Calibri, Times New Roman)
    Text boxes Avoid floating — may not convert cleanly
    Images Avoid — ATS can’t read text inside images
    File name FirstName_LastName_Resume.pdf
    File size Under 1 MB for email/portal uploads

    Conclusion

    File → Export → PDF in Microsoft Word preserves formatting, hyperlinks, and ATS readability. Always run the 5-second Notepad test to verify text-based output. Check mobile rendering before submitting. Keep your master .docx for future edits, but always send the PDF.

    FAQ

    What if my layout changes after converting to PDF?

    Use standard system fonts (Arial, Calibri) that embed correctly. Avoid floating text boxes and complex graphics. Per Enhancv, stick to 0.5–1.0 inch margins to prevent content clipping during conversion.

    Are hyperlinks still clickable after saving as PDF?

    Yes — if you use Export or Save As. “Print to PDF” flattens the document and strips all hyperlinks. Always test links in a PDF viewer before submitting.

    Should I submit PDF or DOCX for ATS?

    PDF is preferred — it protects your visual branding. Only use DOCX if the job description explicitly requires it. Modern ATS handles both formats well, but always verify PDF readability with the Notepad test.
  • How to Embed Images into HTML Code Base64 Quickly (2026)

    How to Embed Images into HTML Code Base64 Quickly (2026)

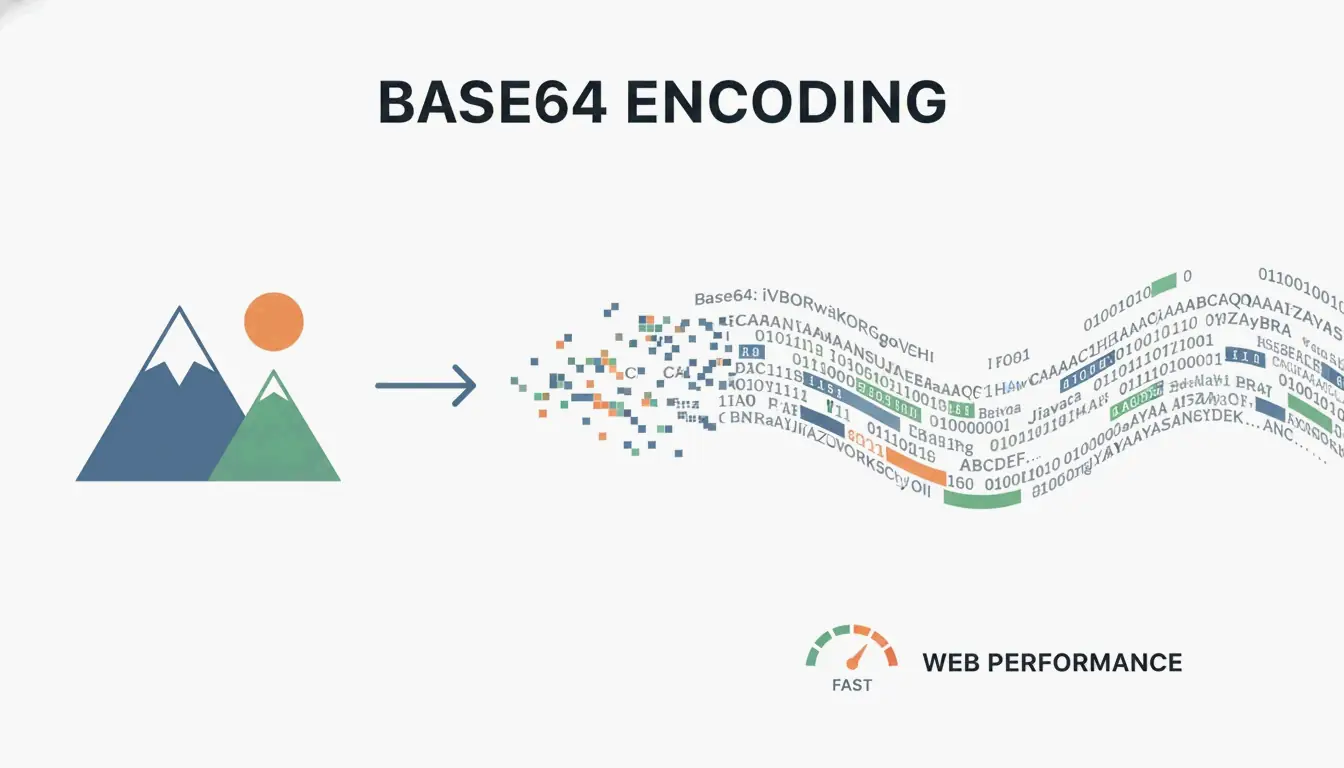
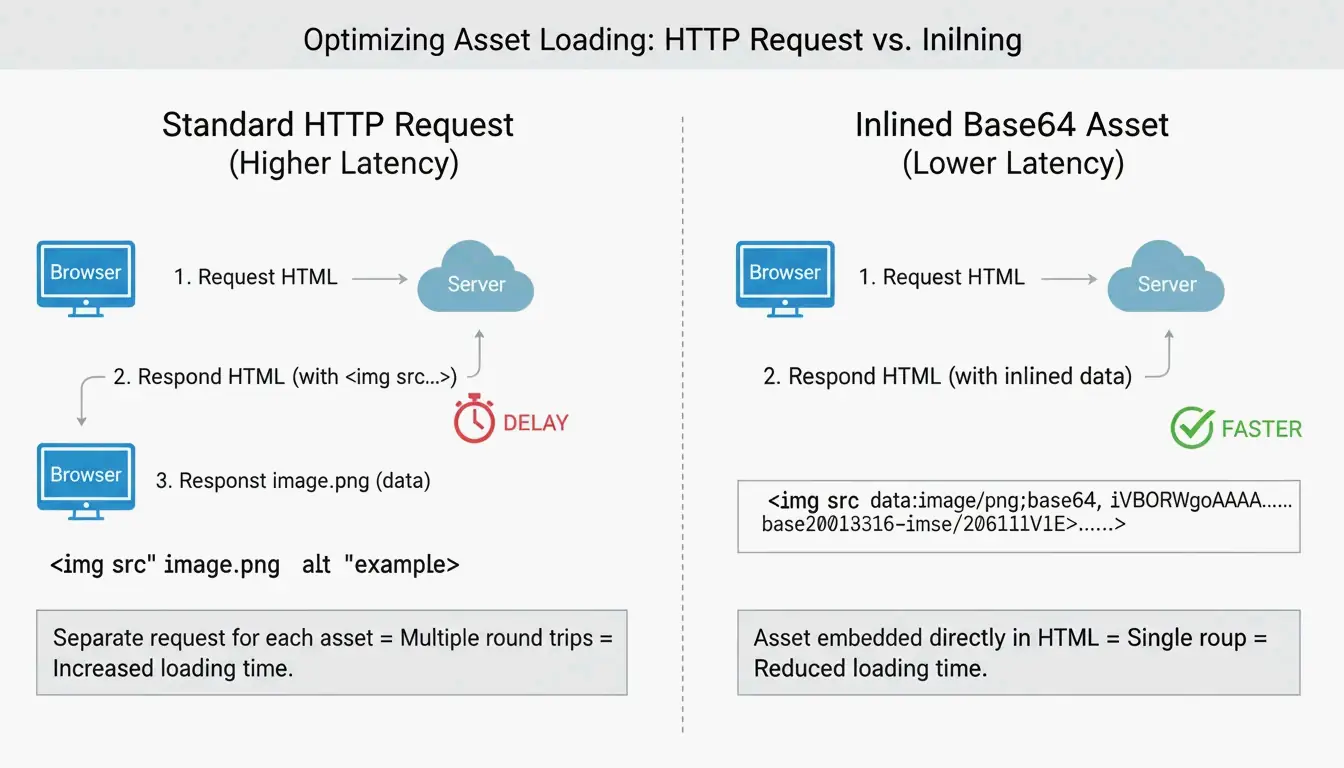
    To embed images in HTML using Base64, convert the image to a Data URI string and place it in the <img> src attribute or CSS background-image property. This eliminates HTTP requests but adds a 33% size overhead — only use for assets under 10 KB.

    Two Methods: HTML and CSS

    Method 1: HTML <img> Tag

    Per DebugBear, the standard format:

    data:image/[format];base64,[encoded_string]
    

    Best for: small logos, above-the-fold icons that must render instantly.

    Method 2: CSS background-image

    background-image: url(data:image/png;base64,PHN2ZyB4bWxucz...);
    

    Per FreeConverto, this works well for navigation icons and buttons — they render the moment CSS is parsed.

    Format Prefixes

    Image Format Data URI Prefix
    PNG data:image/png;base64,
    JPEG data:image/jpeg;base64,
    WebP data:image/webp;base64,
    SVG data:image/svg+xml;base64,
    GIF data:image/gif;base64,
    AVIF data:image/avif;base64,

    Comparison of traditional HTTP request vs. Base64 inlining

    The 33% Size Overhead

    Per Wikipedia, Base64 encoding increases file size by ~33% because it represents binary data using only 64 ASCII characters.

    Original File Base64 Size Overhead
    1 KB ~1.33 KB +0.33 KB
    5 KB ~6.67 KB +1.67 KB
    10 KB ~13.3 KB +3.3 KB
    50 KB ~66.7 KB +16.7 KB
    100 KB ~133 KB +33 KB
    500 KB ~667 KB +167 KB

    The 10KB Rule

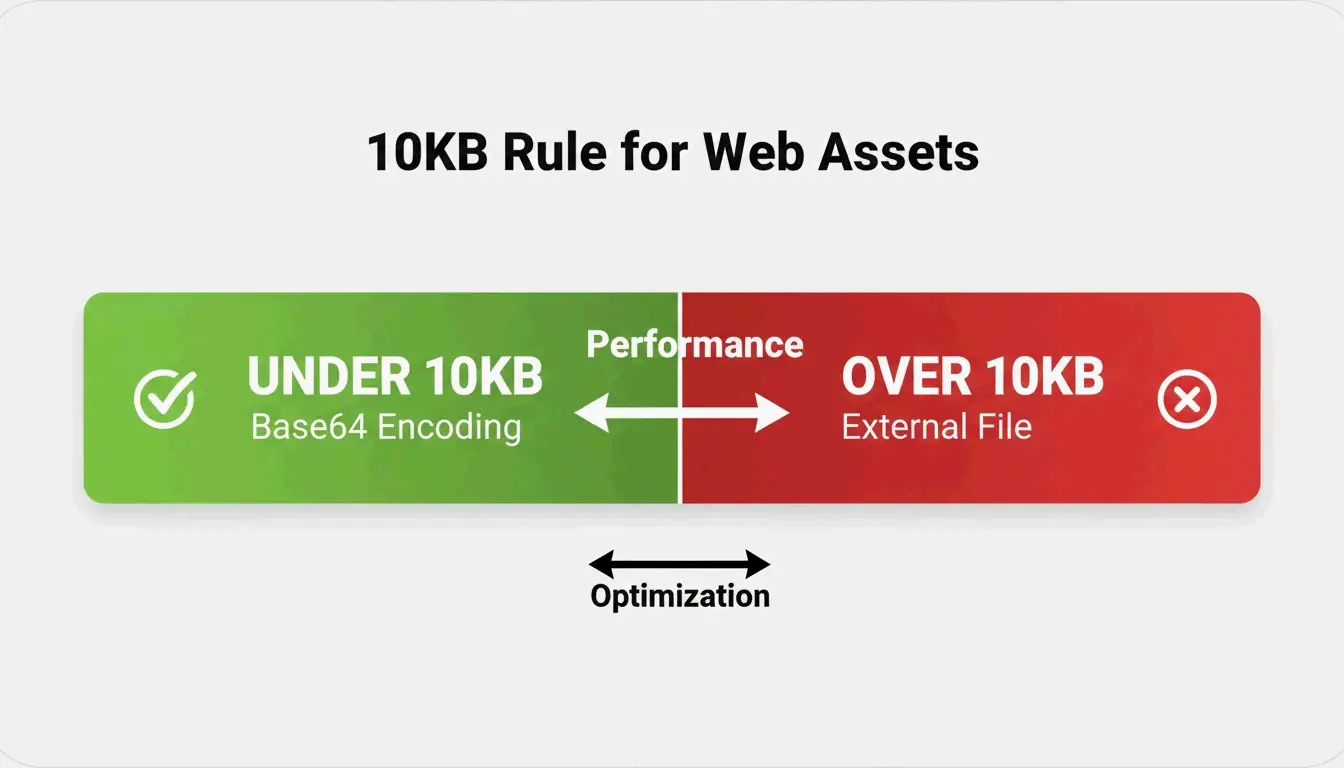
    Per FreeConverto, keep Base64 assets under 5–10 KB. Above 10 KB, the size overhead hurts performance more than the saved HTTP request helps.

    Impact on Core Web Vitals

    A DebugBear analysis showed that HTML files exceeding 1 MB from embedded images cause browser parsing delays, hurting Largest Contentful Paint (LCP).

    The 10KB decision threshold for Base64

    Efficiency Tip: Convert to WebP First

    Per FreeConverto, convert images to WebP before Base64 encoding. WebP is more compressed than PNG/JPEG, producing a shorter Base64 string.

    Format Original Size Base64 Size
    PNG icon 8 KB ~10.7 KB
    WebP (same icon) 4 KB ~5.3 KB

    WebP + Base64 = half the string length of PNG + Base64.

    Automation Tools

    Tool Method Security
    VS Code Extension (“Image to Base64”) Right-click → copy Base64 string Local
    FreeConverto Browser-based FileReader API Files never leave your device
    Node.js script CI/CD build process automation Local/server

    When to Use vs. Avoid Base64

    Use Base64 When Avoid Base64 When
    Small UI icons (< 10 KB) Large photos (> 10 KB)
    Above-the-fold critical assets Images repeated across multiple pages
    Email HTML templates (blocked external images) Assets that benefit from browser caching
    Single-use decorative elements SVGs (use raw XML instead — smaller + compressible)

    Per JustUse.me, Base64 is particularly valuable for email templates where many clients block external images by default.

    Conclusion

    Use Base64 embedding for small UI assets under 10 KB — convert to WebP first for the shortest strings. Keep large photos and shared assets as external files for caching. For email templates, Base64 ensures images display without user interaction.

    FAQ

    Why is Base64 code so long?

    Base64 represents binary data using only 64 ASCII characters — less efficient than binary storage. Every pixel and color value translates into multiple text characters, adding ~33% overhead. High-resolution images produce massive strings.

    Does Base64 provide security or encryption?

    No. Base64 is encoding, not encryption. Per FreeConverto, it’s easily reversible — anyone with the string can decode it instantly without a key. Never rely on it for protecting image content.

    Can I use Base64 for large photographs?

    Highly discouraged. Large Base64 strings bloat HTML/CSS, delay rendering, and hurt SEO. Per DebugBear, they block critical resource loading. Use external files with caching and lazy loading instead.

  • What Is the Difference Between Celsius and Kelvin: Complete Science Guide (2026)

    What Is the Difference Between Celsius and Kelvin: Complete Science Guide (2026)

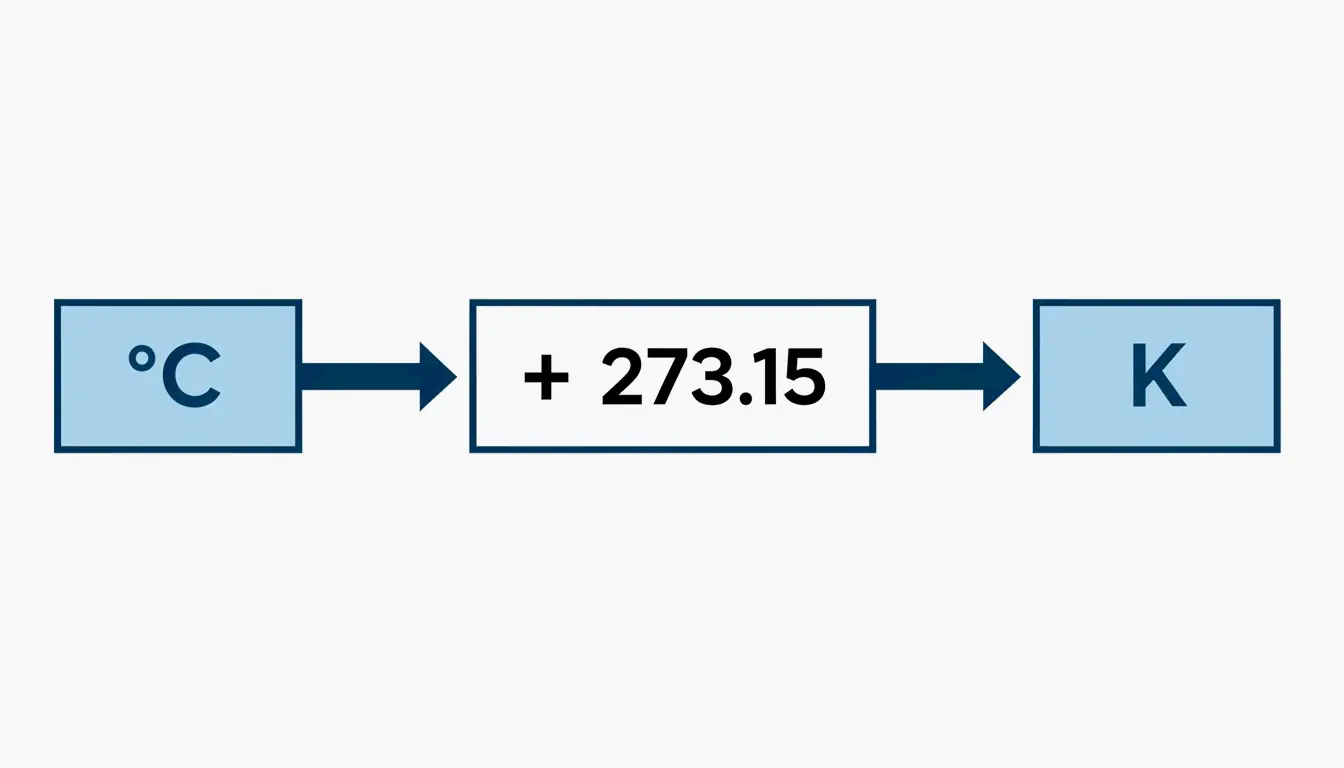
    The difference between Celsius and Kelvin is their zero point: Celsius starts at water’s freezing point (0°C), Kelvin starts at absolute zero (0 K). The degree size is identical — a 1°C change = exactly 1 K change. Convert with K = °C + 273.15.

    Celsius vs. Kelvin: Core Comparison

    Property Celsius (°C) Kelvin (K)
    Scale type Interval scale Ratio scale (absolute)
    Zero point Water freezes (0°C) Absolute zero (0 K)
    Negative values Yes Never
    Degree symbol °C K (no degree symbol since 1967)
    Water boiling 99.974°C (ITS-90) 373.124 K
    Defined by Water phase transitions Boltzmann constant (since 2019)
    Primary use Daily life, weather Science, thermodynamics, astronomy

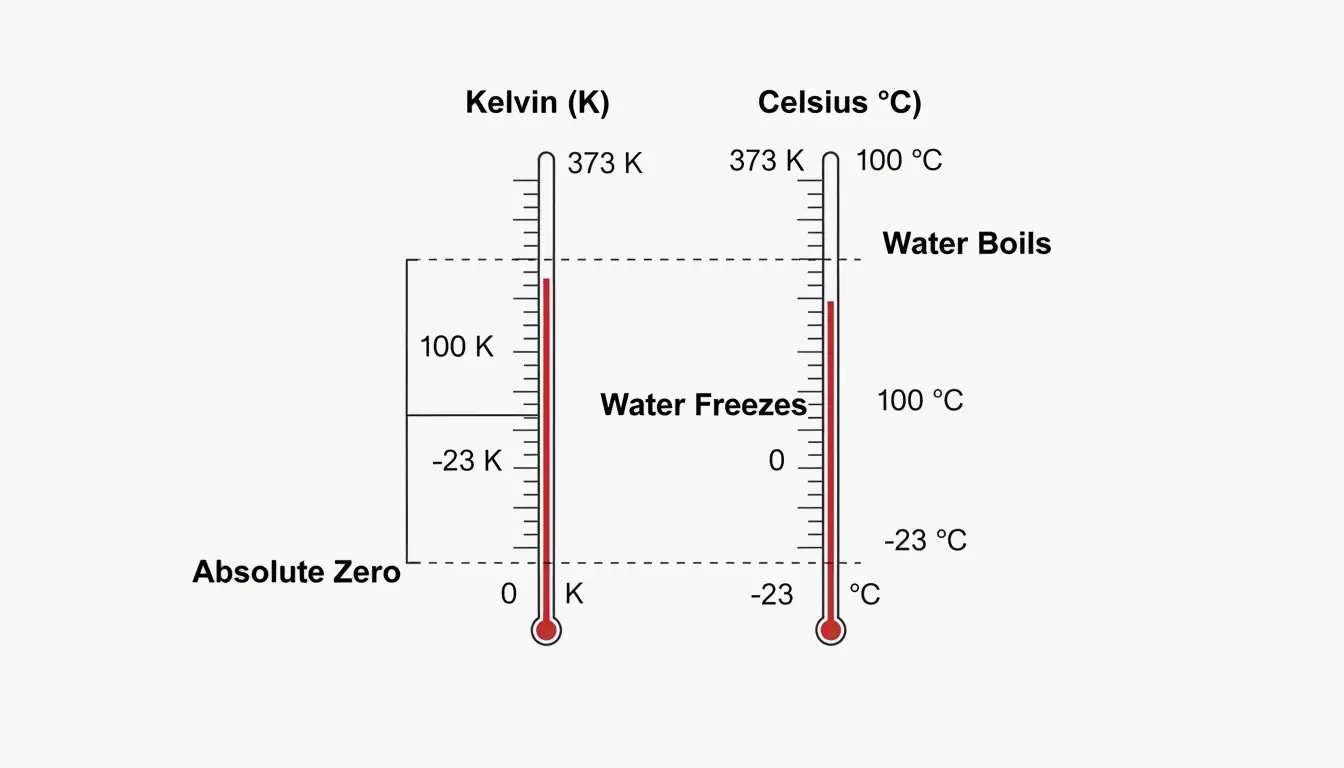
    A minimalist dual-thermometer comparison showing key alignment points (Absolute Zero, Water Freezes, Water Boils).

    Why Absolute Zero Matters

    Per Wikipedia, absolute zero is where particles have minimal thermal motion. This occurs at −273.15°C. Because Kelvin starts at this physical floor, it enables ratio comparisons — 400 K has exactly twice the thermal energy of 200 K. The same logic fails with Celsius: 20°C is not “twice as hot” as 10°C.

    1:1 Interval Ratio

    NIST confirms that 1 kelvin = 1 degree Celsius in magnitude. This makes conversion purely additive — no multiplication or division needed, just the 273.15 offset.

    Conversion: Formula and Examples

    Direction Formula Example
    °C → K K = °C + 273.15 20°C = 293.15 K
    K → °C °C = K − 273.15 300 K = 26.85°C

    Per Vedantu:

    Common Temperature Celsius Kelvin
    Absolute zero −273.15°C 0 K
    Water freezes 0°C 273.15 K
    Room temperature 20°C 293.15 K
    Body temperature 37°C 310.15 K
    Water boils 99.974°C 373.124 K
    Sun’s surface 5,499°C 5,772 K

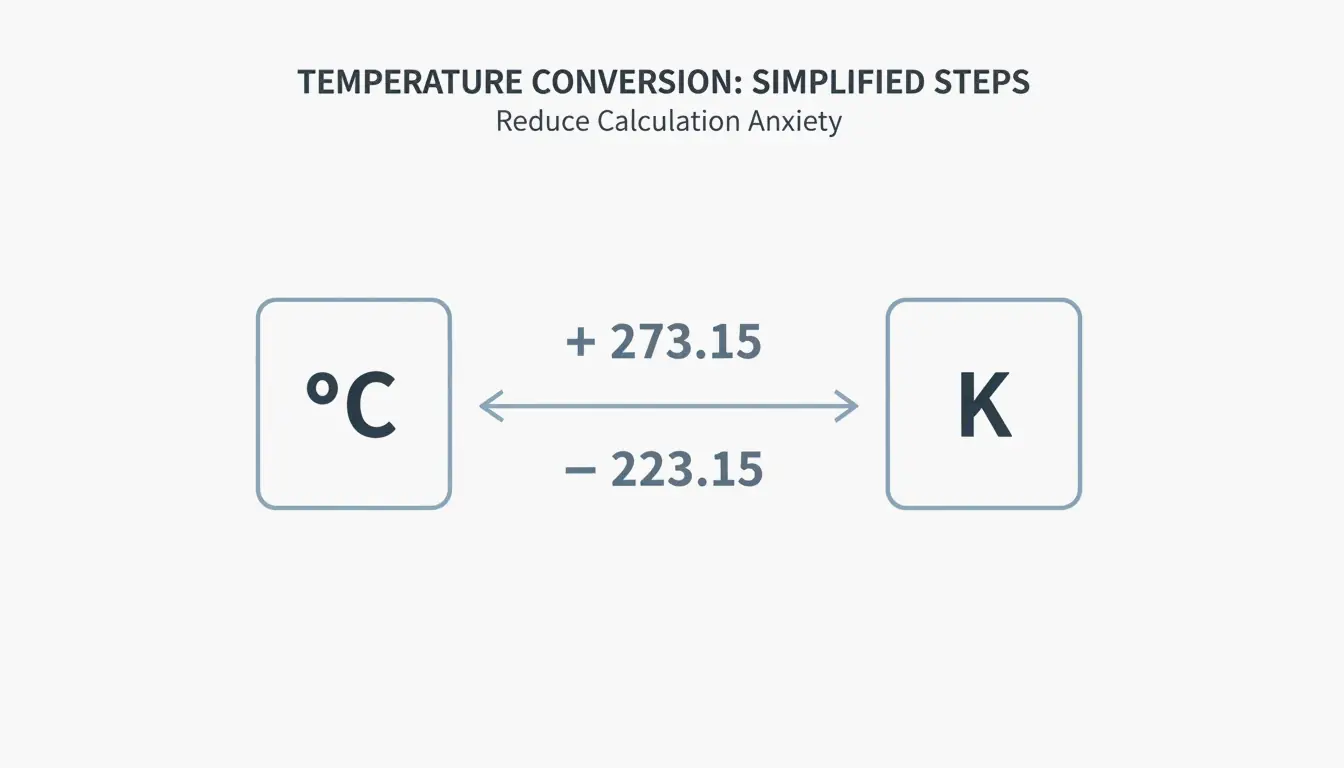
    A simple 2-step visual showing the conversion direction and the +273.15 offset.

    Common mistake: Writing “300 °K” — incorrect since 1967. The unit is simply “K”.

    2019 SI Redefinition: Boltzmann Constant

    Before 2019 After 2019
    Kelvin defined by Triple Point of Water (273.16 K) Kelvin defined by Boltzmann constant
    Boltzmann constant had measurement uncertainty Boltzmann constant is exact: 1.380649 × 10⁻²³ J/K
    Triple Point was exact Triple Point now has slight uncertainty
    Depended on water isotopic composition Anchored to universal physical constant

    Per NIST, this shift ensures temperature measurement is independent of any substance — critical for quantum computing (milli-kelvin processors) and deep-space sensors.

    Why Scientists Use Kelvin: The Energy Perspective

    Per Chemistry LibreTexts, Kelvin is directly tied to kinetic energy. This makes it essential for:

    Application Why Kelvin Is Required
    Ideal Gas Law (pV=nRT) Using Celsius produces negative pressure/volume — physically impossible
    Astronomy Star temperatures measured in Kelvin (Sun: 5,772 K)
    Cryogenics Liquid nitrogen at 77 K; superconductors near absolute zero
    Thermodynamics Energy ratios (E = k_BT) only work on absolute scale

    The Pioneers

    Scientist Contribution
    Anders Celsius (1701–1744) Proposed centigrade scale (1742); originally 0°=boiling, 100°=freezing; reversed posthumously
    Lord Kelvin (1824–1907) Proposed absolute thermometric scale (1848); calculated absolute zero at ~−273°C

    Conclusion

    Celsius is relative (interval scale); Kelvin is absolute (ratio scale). Both share identical degree sizes, offset by 273.15. For daily life, use Celsius. For any scientific calculation involving energy ratios, gas laws, or thermodynamics, use Kelvin — without the degree symbol.

    FAQ

    Is it correct to say “degrees Kelvin”?

    No. Per SI rules since 1967, the unit is “kelvins” (K). Write “300 K”, never “300 °K”.

    What temperature is the same in both Celsius and Kelvin?

    None. Both scales use identical intervals offset by 273.15 — they move in parallel and never intersect. (Celsius and Fahrenheit meet at −40.)

    Why does Kelvin have no negative numbers?

    Kelvin starts at absolute zero — the point of zero kinetic energy. Since you cannot have less than zero molecular motion, the scale starts at 0 and only increases.

  • How to Convert Square Meters to Acres & Hectares: US Buyer’s Guide (2026)

    How to Convert Square Meters to Acres & Hectares: US Buyer’s Guide (2026)

    To convert square meters to acres, multiply by 0.000247105 (or divide by 4,046.86). One hectare = exactly 10,000 m² ≈ 2.471 acres. These constants are locked by the 1959 International Yard and Pound Agreement for global real estate and precision farming.

    Conversion Formulas

    Conversion Formula Example
    m² → acres m² × 0.000247105 10,000 m² = 2.471 ac
    m² → hectares m² ÷ 10,000 10,000 m² = 1 ha
    acres → m² acres × 4,046.8564 1 ac = 4,046.86 m²
    hectares → acres ha × 2.47105 1 ha = 2.471 ac
    acres → hectares acres × 0.404686 1 ac = 0.4047 ha
    acres → sq ft acres × 43,560 1 ac = 43,560 ft²

    For legal documents, Intelligent Calculator recommends the 8-decimal constant: 0.0002471054.

    Quick Reference Table

    Square Meters Hectares Acres Visual Comparison
    250 m² 0.025 ha 0.062 ac Standard UK garden allotment per Pro Calculator UK
    1,000 m² 0.1 ha 0.247 ac —
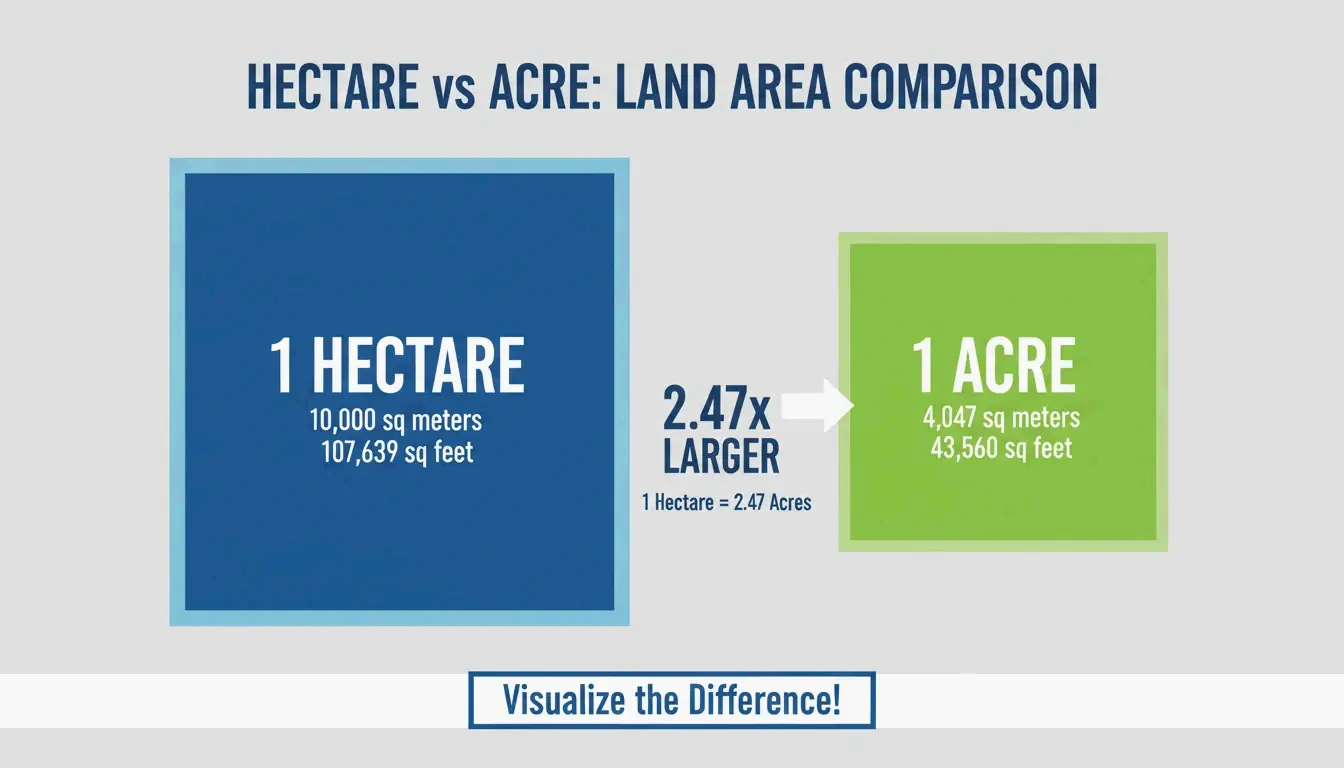
    4,047 m² 0.4047 ha 1.0 ac 208.7 ft × 208.7 ft square
    5,350 m² 0.535 ha 1.32 ac American football field (with end zones)
    10,000 m² 1.0 ha 2.471 ac 100 m × 100 m square
    40,469 m² 4.047 ha 10 ac Small farm plot
    100,000 m² 10 ha 24.71 ac —
    3,410,000 m² 341 ha 843 ac Central Park, New York

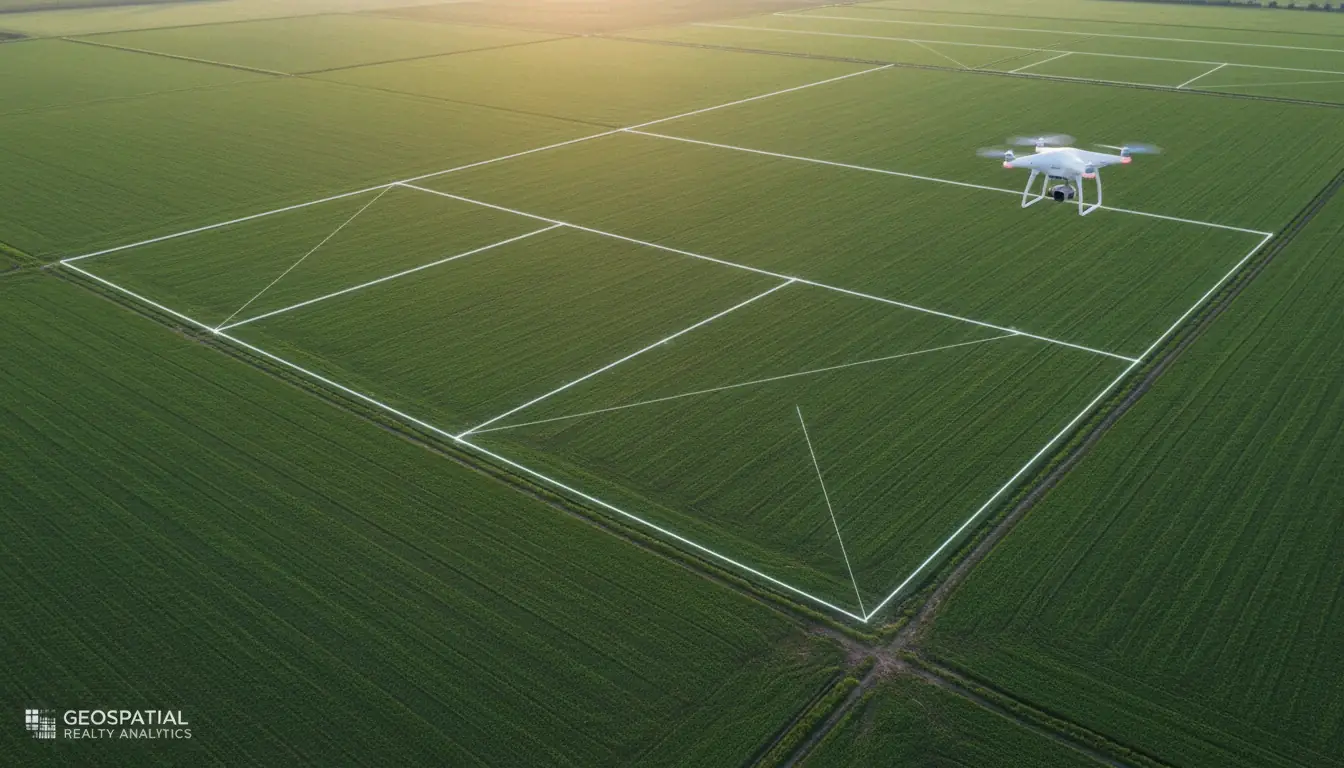
    A simple visual comparison showing the scale difference between 1 Hectare and 1 Acre

    Precision Warning: Rounding Costs Money

    Error Impact At $50,000/acre (CA vineyard)
    0.001 ha rounding 10 m² lost ~$124 error
    Using 0.000247 vs 0.0002471054 0.1 m² per acre Compounds across large parcels
    Omitting decimal entirely Catastrophic Property line disputes

    Intelligent Calculator notes that 0.001 hectares = 10 m² — the size of a small bathroom. In California vineyard country at $50,000+ per acre, precision matters.

    GIS Workflow: ArcGIS Pro Batch Conversion

    Esri Support recommends the “Calculate Field” tool:

    1. Open Attribute Table → add field of type Double
    2. Right-click field → Calculate Field
    3. Set Expression Type to Python 3
    4. Enter: !Shape_Area! * 0.0002471054

    3-step GIS workflow for batch area conversion

    Alternative: use Calculate Geometry tool and select “International Acres” from the menu — ArcGIS handles coordinate systems and geodesic corrections automatically.

    Agriculture: Unit Choice Affects Yield and Cost

    Region Yield Unit Fertilizer Unit
    Global / Metric Tonnes per hectare kg per hectare
    United States Bushels per acre lbs per acre

    Critical: 4 kg/hectare ≠ 4 kg/acre. Applying the wrong rate causes over-application (wasted money) or under-application (lost yield).

    Metric Value
    US farmland average (2026 USDA NASS) $4,170 per acre
    CA vineyard land $50,000+ per acre
    Square feet per acre 43,560 ft² per FuturisticMath

    Conclusion

    m² × 0.000247105 = acres. m² ÷ 10,000 = hectares. For legal land transactions, use the 8-decimal constant. For GIS work, automate with ArcGIS Pro’s Calculate Field. For agriculture, verify your unit system before applying fertilizer or reporting yields.

    FAQ

    How many square feet are in one acre?

    43,560 ft² exactly. This is roughly a 208.71 ft × 208.71 ft square.

    Which is larger, a hectare or an acre?

    A hectare is significantly larger. 1 ha = 2.471 acres. An acre is only ~40% of a hectare.

    What is the difference between international acre and US survey acre?

    The international acre = exactly 0.40468564 hectares (standard for modern real estate). The US survey acre is ~2 ppm larger. The difference matters in large federal land surveys but is negligible for small lots.

    How do I calculate acreage from irregular property?

    Break the area into triangles/rectangles, calculate each in square meters, sum them, then multiply the total by 0.000247105.

  • Relationship Between Celsius and Kelvin: A Simple Guide (2026)

    Relationship Between Celsius and Kelvin: A Simple Guide (2026)

    Celsius (°C) and Kelvin (K) share identical degree sizes but different zero points. Convert with K = °C + 273.15. Celsius is relative (0°C = water freezes); Kelvin is the SI base unit starting at absolute zero (0 K), defined since 2019 by the Boltzmann constant.

    Celsius vs. Kelvin: Core Differences

    Property Celsius (°C) Kelvin (K)
    Type Relative scale Absolute SI base unit
    Zero point Water freezes (0°C) Absolute zero (0 K)
    Degree symbol Yes (°C) No — just “K”
    Negative values Yes Never
    Defined by Water phase points Boltzmann constant (since 2019)
    Primary use Weather, cooking, daily life Science, engineering, quantum computing

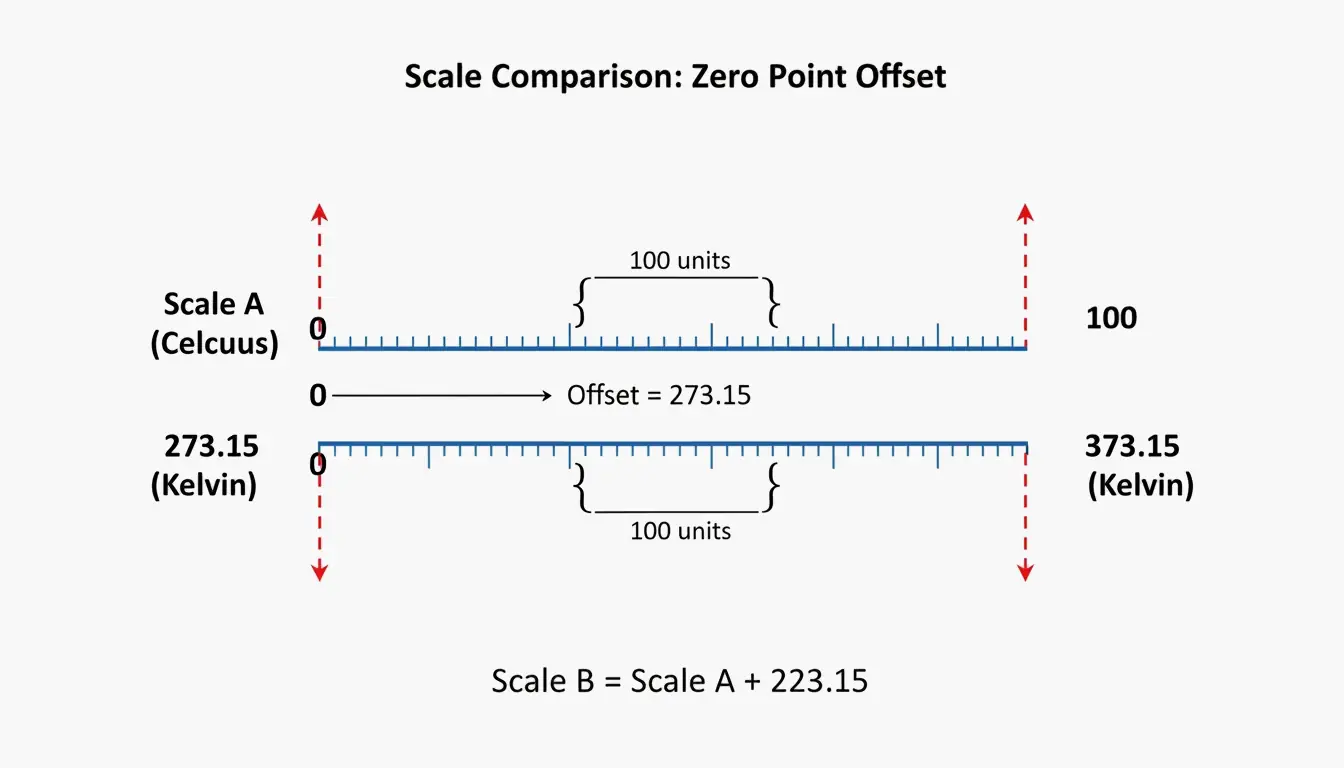
    1°C change = exactly 1 K change. Only the starting line differs by 273.15.

    Celsius and Kelvin scale parallel comparison

    Conversion Formulas

    Direction Formula Example
    °C → K K = °C + 273.15 20°C = 293.15 K
    K → °C °C = K − 273.15 300 K = 26.85°C
    °C → °F (bonus) °F = (°C × 9/5) + 32 20°C = 68°F

    Never round to 273. Per Oreate AI Guides, dropping the “.15” creates a 0.27°F error — unacceptable in aerospace or precision manufacturing.

    Simple conversion step flow

    Temperature Reference Table

    Condition Celsius (°C) Kelvin (K)
    Absolute zero −273.15 0
    Boiling point of nitrogen −195.8 77.35
    Freezing point of water 0 273.15
    Standard room temperature 20 293.15
    Normal body temperature 37 310.15
    Boiling point of water 99.98 373.13
    Kelvin = Fahrenheit intersection 301.44 574.59

    Why Kelvin Uses No Degree Symbol

    The unit is “kelvin” (K), not “degrees Kelvin” (°K). This rule was set in 1967 by the General Conference on Weights and Measures. Kelvin is an absolute unit — like meters or kilograms — not a degree measurement.

    The 2019 Boltzmann Constant Redefinition

    Before 2019, the kelvin was defined by the triple point of water (273.16 K) — where water exists as solid, liquid, and gas simultaneously. This was problematic because results varied slightly with water isotopic composition.

    On May 20, 2019, the CIPM redefined the kelvin by fixing the Boltzmann constant ($k_B$) at exactly 1.380649 × 10⁻²³ J/K per NIST.

    Impact on 2026 Industries

    Industry Application Why Kelvin Matters
    Quantum computing Milli-kelvin processor cooling Constant-based calibration replaces water reference
    Aerospace Space probe sensors near 3 K Accurate at extreme cold
    Metrology Primary thermometers (acoustic) Temperature from speed of sound via E = k_B T

    Boltzmann constant and energy relationship

    Absolute Zero and Temperature Extremes

    Absolute zero (0 K = −273.15°C) is the theoretical minimum energy state. The Third Law of Thermodynamics states it can never be fully reached.

    Record Temperature Source
    Coldest lab record (2021) 38 picokelvin (38 × 10⁻¹² K) Guinness World Records
    Coldest natural place ~1 K (Boomerang Nebula) 5,000 light-years away
    Cosmic microwave background 2.725 K Residual Big Bang radiation

    Why the Ideal Gas Law Requires Kelvin

    The formula pV = nRT only works with kelvins. Using 0°C would suggest zero pressure or volume — physically impossible. Kelvin keeps the math consistent across all states of matter.

    The Pioneers

    Scientist Era Contribution
    Anders Celsius 1701–1744 Proposed centigrade scale (1742); originally inverted (0°=boiling, 100°=freezing), later reversed by colleagues
    Lord Kelvin 1824–1907 Proposed absolute thermometric scale (1848); calculated absolute zero at ~−273°C

    Conclusion

    K = °C + 273.15. The degree size is identical; only the zero point shifts. Use Celsius for daily life; use Kelvin for any scientific, engineering, or thermodynamic calculation. Since 2019, Kelvin is anchored to the Boltzmann constant — a universal physical constant, not a property of water.

    FAQ

    Is it correct to say “degrees Kelvin”?

    No. The unit is simply “kelvins” (K). Write “300 K”, never “300 °K”. This rule was formalized in 1967.

    Why is there no negative temperature on the Kelvin scale?

    Kelvin measures energy. Since molecular motion cannot fall below its minimum state (absolute zero), the scale starts at 0 and only increases. You cannot have negative kinetic energy.

    At what temperature are Kelvin and Fahrenheit equal?

    Approximately 574.59 — the only point where both scales show the same numerical value. Celsius and Fahrenheit meet at −40.

    What is the triple point of water’s role today?

    Before 2019, it defined the kelvin (273.16 K exactly). Now the Boltzmann constant is the formal definition, but the triple point is still used in labs to calibrate precision thermometers because it’s easily reproducible.

  • CM to Feet and Inches: Ultimate Conversion Guide & Height Chart (2026)

    CM to Feet and Inches: Ultimate Conversion Guide & Height Chart (2026)

    To convert cm to feet and inches: divide cm by 2.54 to get total inches, then divide by 12 for feet with the remainder as inches. Example: 180 cm = 70.87 in = 5’10.9″. Per NIST SP 811, 1 foot = exactly 30.48 cm, 1 inch = exactly 2.54 cm.

    The 3-Step Formula

    Step Operation Example (180 cm)
    1. Total inches cm ÷ 2.54 180 ÷ 2.54 = 70.866 in
    2. Feet total inches ÷ 12 (whole number) 70.866 ÷ 12 = 5 ft
    3. Remaining inches decimal remainder × 12 0.866 × 12 = 10.4 in
    Result — 5’10.4″

    Alternative for Step 3: (original cm − feet × 30.48) ÷ 2.54 = remaining inches.

    Never round 2.54 to 2.5 — this creates a 1.6% error that compounds in construction and medical records.

    Height Chart: CM to Feet & Inches

    Centimeters Feet & Inches (rounded) Exact Imperial Context
    150 cm 4’11” 4’11.06″ —
    155 cm 5’1″ 5’1.02″ —
    159 cm 5’3″ 5’2.99″ Global avg female
    160 cm 5’3″ 5’2.99″ —
    165 cm 5’5″ 5’4.96″ —
    170 cm 5’7″ 5’6.93″ —
    171 cm 5’7″ 5’7.32″ Global avg male
    175 cm 5’9″ 5’8.90″ —
    180 cm 5’11” 5’10.87″ —
    185 cm 6’1″ 6’0.83″ —
    190 cm 6’3″ 6’2.80″ —
    200 cm 6’7″ 6’6.74″ —

    Height averages per GIGAcalculator.

    Diurnal Variation

    Humans are tallest in the morning and can “shrink” by up to 1 cm (0.39 in) by evening as spinal discs compress from standing.

    Decimal Feet ≠ Feet + Inches

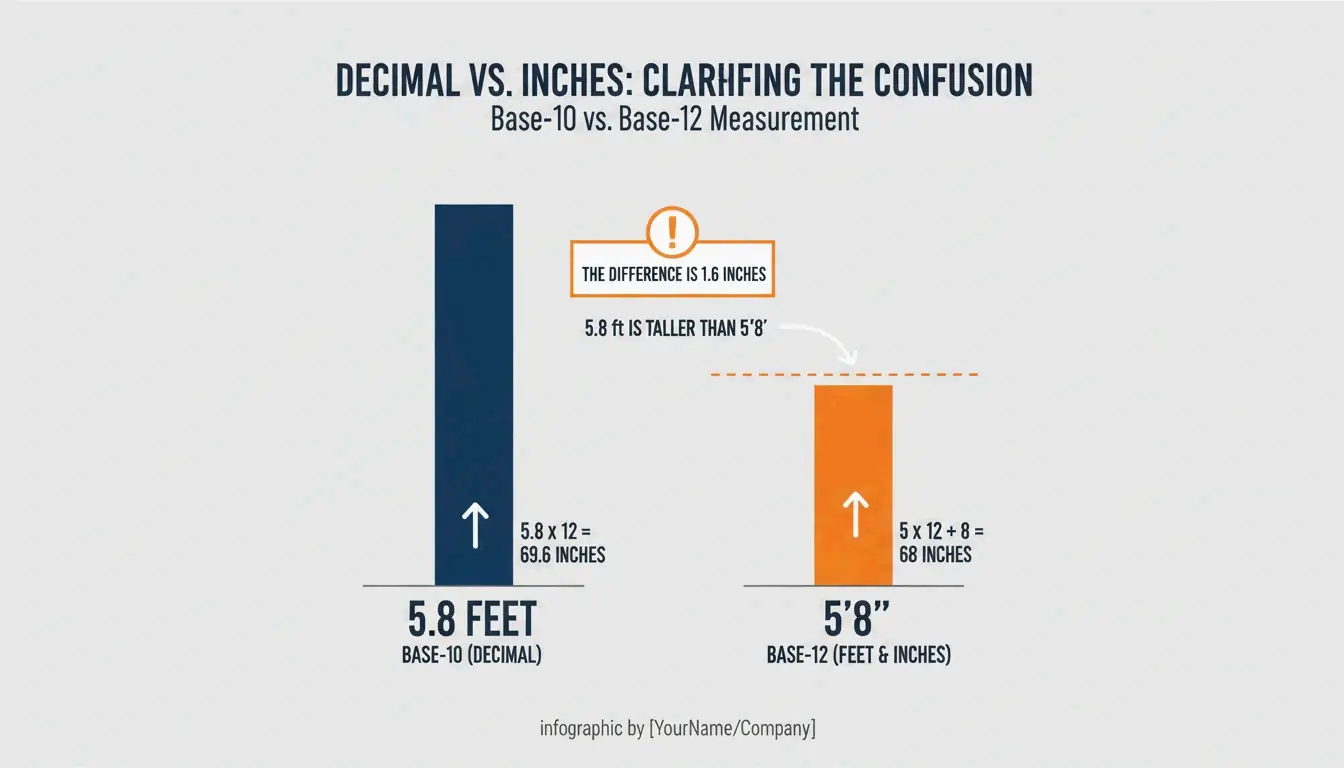
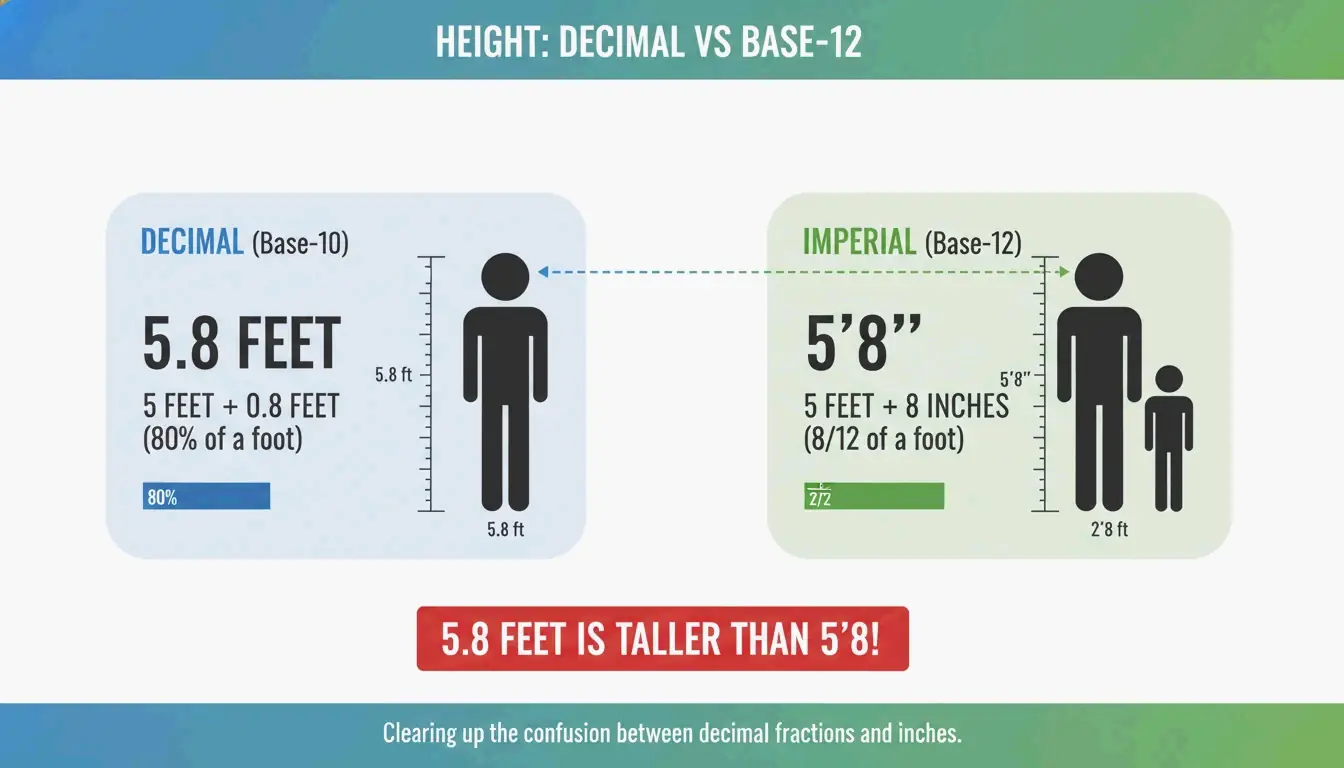
    Critical trap: 5.8 feet is NOT 5’8″ — it’s 5’9.6″ (0.8 × 12 = 9.6 in).

    Misread Actual Difference
    5.8 ft read as 5’8″ Actual: 5’9.6″ +1.6 inches
    6.1 ft read as 6’1″ Actual: 6’1.2″ +0.2 inches
    5.5 ft read as 5’5″ Actual: 5’6.0″ +1.0 inches

    A side-by-side visual comparison showing why 5.8 feet is taller than 5'8".

    Decimal Inches to Fractions (Construction)

    For US tape measures (base-16):

    Decimal Inches × 16 Fraction
    0.25 in 4/16 1/4″
    0.50 in 8/16 1/2″
    0.75 in 12/16 3/4″
    0.0625 in 1/16 1/16″
    0.4375 in 7/16 7/16″

    Multiply the decimal portion by 16, round to nearest whole number, simplify the fraction.

    Standards: 1959 Agreement & US Survey Foot

    Standard Definition Status (2026)
    International foot 1 ft = 30.48 cm exactly Active
    International inch 1 in = 2.54 cm exactly Active
    US Survey Foot ~2 ppm different from international Retired Jan 1, 2023 per NIST

    The meter is defined by the speed of light (299,792,458 m/s) per the BIPM.

    Practical: Furniture & Home Conversion (IKEA)

    Item Metric (cm) Imperial US Standard Difference
    European Queen bed 160 cm wide 62.99 in US Queen: 60 in +3 inches wider
    European ceiling 250 cm 8’2.4″ US ceiling: 8′ (243.84 cm) +2.4 inches taller
    Standard door 200 cm 6’6.7″ US door: 6’8″ (203.2 cm) −2.5 inches shorter

    Contractors must use the exact 2.54 factor when installing imported cabinets or appliances.

    Child Height Prediction

    Method Accuracy Requirements
    Multiplier Method (Paley et al.) 85% within 5 cm Child’s current height + age
    Khamis-Roche More precise Both parents’ heights required

    Per GIGAcalculator, the Multiplier Method works across ethnicities and requires less input data.

    Conclusion

    cm → total inches (÷2.54) → feet (÷12) + remaining inches. Never confuse decimal feet with feet+inches. For construction, convert decimal inches to 1/16th fractions. For furniture imports, check exact cm dimensions against US standards before purchasing.

    FAQ

    Why is 5.8 feet not the same as 5’8″?

    Feet use decimal (base-10) but inches use base-12. Multiply the decimal portion by 12: 0.8 × 12 = 9.6 inches. So 5.8 feet = 5’9.6″, nearly 2 inches taller than 5’8″.

    What is the average global height?

    Per GIGAcalculator: men 171 cm (5’7″), women 159 cm (5’3″). Varies significantly by region — the Netherlands averages are notably higher.

    How do I convert decimal inches to fractions for construction?

    Multiply the decimal portion by your target denominator (16 for 1/16ths), round to the nearest whole number, and simplify. Example: 0.75 × 16 = 12/16 = 3/4 inch.

  • CM to Inches: Complete Guide to Formulas, Height Conversion & Standards

    CM to Inches: Complete Guide to Formulas, Height Conversion & Standards

    To convert cm to inches, divide by 2.54. Formula: inches = cm ÷ 2.54. For quick estimates, multiply by 0.39. This ratio is fixed by the NIST and the 1959 International Yard and Pound Agreement — it applies to every conversion, from height tracking to CNC machining.

    Conversion Methods

    Method Formula Example (30 cm) Precision
    Exact cm ÷ 2.54 30 ÷ 2.54 = 11.811 in Full
    Multiply cm × 0.3937 30 × 0.3937 = 11.811 in Full
    Mental estimate cm × 0.39 30 × 0.39 ≈ 11.7 in ~1% error
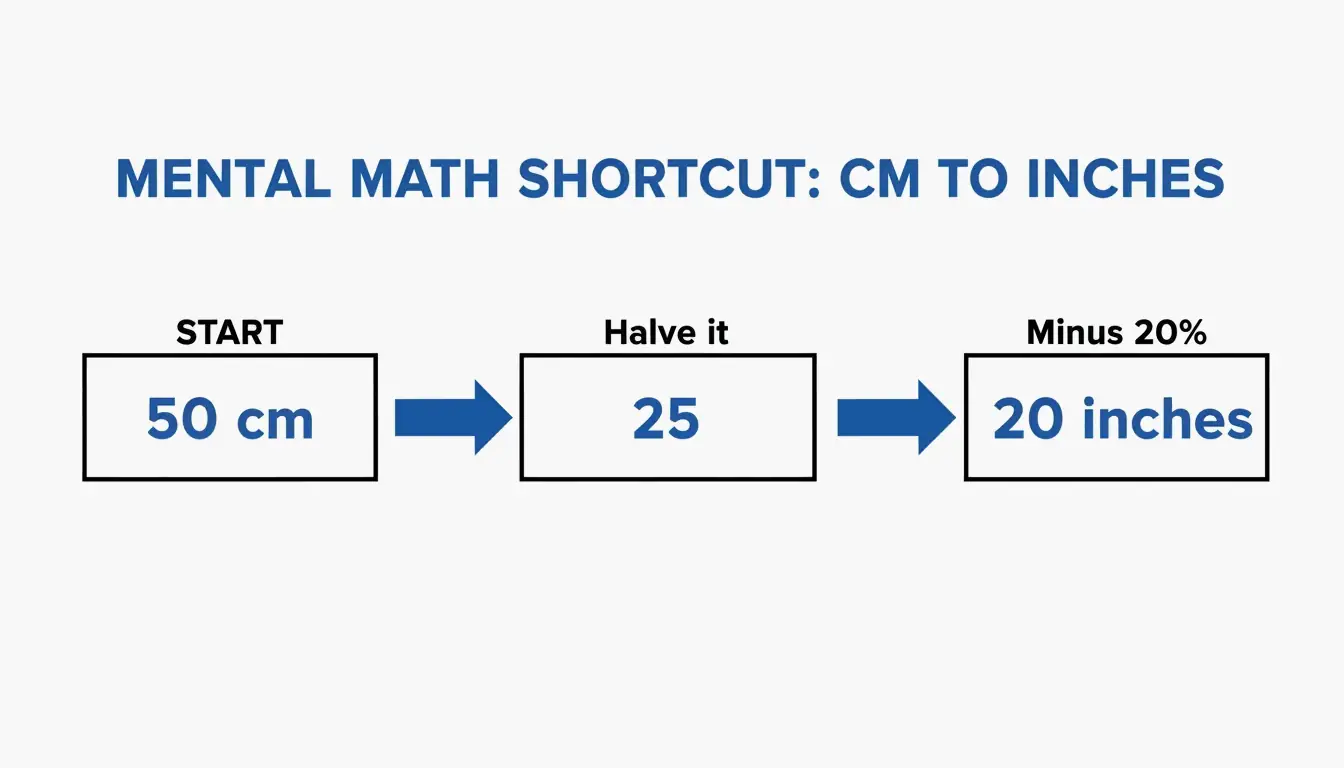
    Halve & subtract 20% (cm ÷ 2) × 0.8 50 cm → 25 → 20 in ~1.5% error

    Go Tools confirms a standard 30 cm ruler = 11.81 inches.

    A 3-step visualization of the 'halve and subtract 20%' mental math shortcut

    Quick Conversion Table

    Centimeters Inches (exact) Feet + Inches
    1 cm 0.394 in —
    10 cm 3.937 in 3′ 15/16″
    30 cm 11.811 in 11′ 13/16″
    50 cm 19.685 in 1′ 7 11/16″
    100 cm 39.370 in 3′ 3 3/8″
    150 cm 59.055 in 4′ 11 1/16″
    159 cm 62.598 in 5′ 3″ (avg woman)
    171 cm 67.323 in 5′ 7″ (avg man)
    178 cm 70.079 in 5′ 10″

    Height averages per Best Calculators.

    Height Conversion: cm to Feet + Inches

    Critical: Decimal feet ≠ feet + inches. 5.8 feet is 5 feet + 9.6 inches, NOT 5 feet 8 inches.

    Two-Step Method

    1. Total inches: cm ÷ 2.54 (e.g., 171 ÷ 2.54 = 67.32 in)
    2. Split: ÷ 12 for feet, remainder is inches (67.32 ÷ 12 = 5 ft, 7.32 in → 5’7″)

    Comparison showing why 5.8 feet is not 5'8"

    Best Calculators and the WHO recommend recording height in centimeters for medical accuracy.

    Standards: NIST and the 1959 Agreement

    Standard Definition Status (2026)
    International inch Exactly 2.54 cm (25.4 mm) Active
    International foot Exactly 0.3048 m Active
    US Survey Foot 1 m = 39.37 in (slightly different) Retired Jan 1, 2023 per NIST

    All professional mapping and engineering in 2026 must use the international foot (0.3048 m).

    Precision Warning

    Using 0.39 instead of 0.3937 creates a 0.7 mm error per meter — exceeding the ±0.05 mm tolerance for precision CNC machining, per Go Tools.

    Practical Applications

    Screen Diagonals

    Screen Size Diagonal (cm) Approximate Width (cm)
    55-inch TV 139.7 cm ~121.8 cm
    27-inch monitor 68.6 cm ~59.8 cm
    13-inch laptop 33.0 cm ~28.6 cm

    Go Tools notes screen width is always less than the diagonal measurement.

    Paper Sizes

    Standard Size In Inches
    US Letter 21.59 × 27.94 cm 8.5 × 11 in
    A4 21.0 × 29.7 cm 8.27 × 11.69 in

    A4 is 0.6 cm narrower but 1.76 cm taller than US Letter. Incorrect scaling between these standards ruins print layouts.

    Developer Implementation

    // Exact factor per 1959 Agreement
    const CM_PER_INCH = 2.54;
    const cmToInches = (cm) => cm / CM_PER_INCH;
    
    
    def cm_to_inches(cm):
        inches = cm / 2.54
        assert abs(inches * 2.54 - cm) < 1e-10
        return inches
    

    Excel: =CONVERT(A1, "cm", "in") — uses official international standards.

    Conclusion

    cm ÷ 2.54 = inches. For casual use, the 0.39 shortcut works. For engineering, medical, or construction work, always use the exact 2.54 factor — small rounding errors compound over distance. As of 2026, the international foot (0.3048 m) is the only legal standard for professional work.

    FAQ

    Why is 1 inch exactly 2.54 cm?

    The 1959 International Yard and Pound Agreement unified US and British imperial systems with the metric system. The international yard was set at exactly 0.9144 meters, making 1 inch = 25.4 mm = 2.54 cm.

    How do I convert cm to fractional inches for woodworking?

    1. Divide cm by 2.54 to get decimal inches
    2. Take the decimal portion and multiply by your desired denominator (e.g., 16 for 1/16ths)
    3. Round to nearest whole number for the fraction

    Is a centimeter larger than an inch?

    No. 1 inch = 2.54 cm. A centimeter is roughly fingernail width; an inch is closer to adult thumb width.

    How to use Excel for cm to inches conversion?

    Use =CONVERT(number, "cm", "in") — this uses NIST international standards and is the most accurate method for bulk spreadsheet conversions.

  • Can AI Remove Watermark from Photo? 2026 Guide to the Best Tools and Techniques

    Can AI Remove Watermark from Photo? 2026 Guide to the Best Tools and Techniques

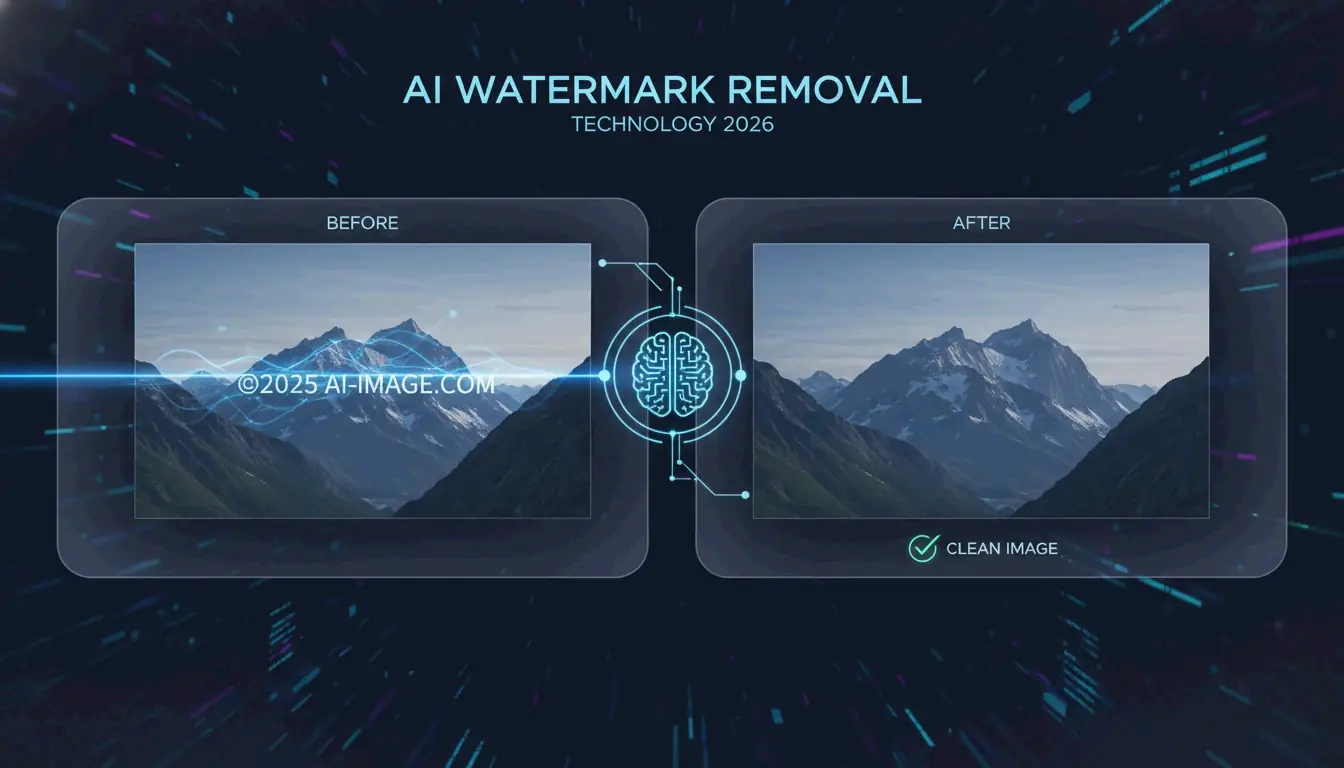
    Yes, in 2026, AI can remove watermark from photo files with high accuracy. Using deep learning, tools like Pixelbin and HitPaw employ Generative Inpainting to reconstruct backgrounds or Reverse Alpha Blending to mathematically reverse semi-transparent overlays. These techniques can clean complex AI-generated labels — such as Gemini’s “Nano Banana” — without degrading image quality.

    How Does AI Remove Watermark from Photo? The 2026 Technical Breakdown

    Watermark removal has moved far beyond manual clone-stamp editing. Modern neural networks analyze image context to intelligently restore covered areas. In 2026, the real challenge is not visibility but how the watermark is embedded. Standard logos are straightforward to erase, but invisible markers like SynthID are woven into the image’s mathematical structure, making them extremely difficult to remove without quality loss.

    According to HitPaw, their AI solution maintains a 98% satisfaction rate across more than 6.5 million downloads. These systems rely on two core methods:

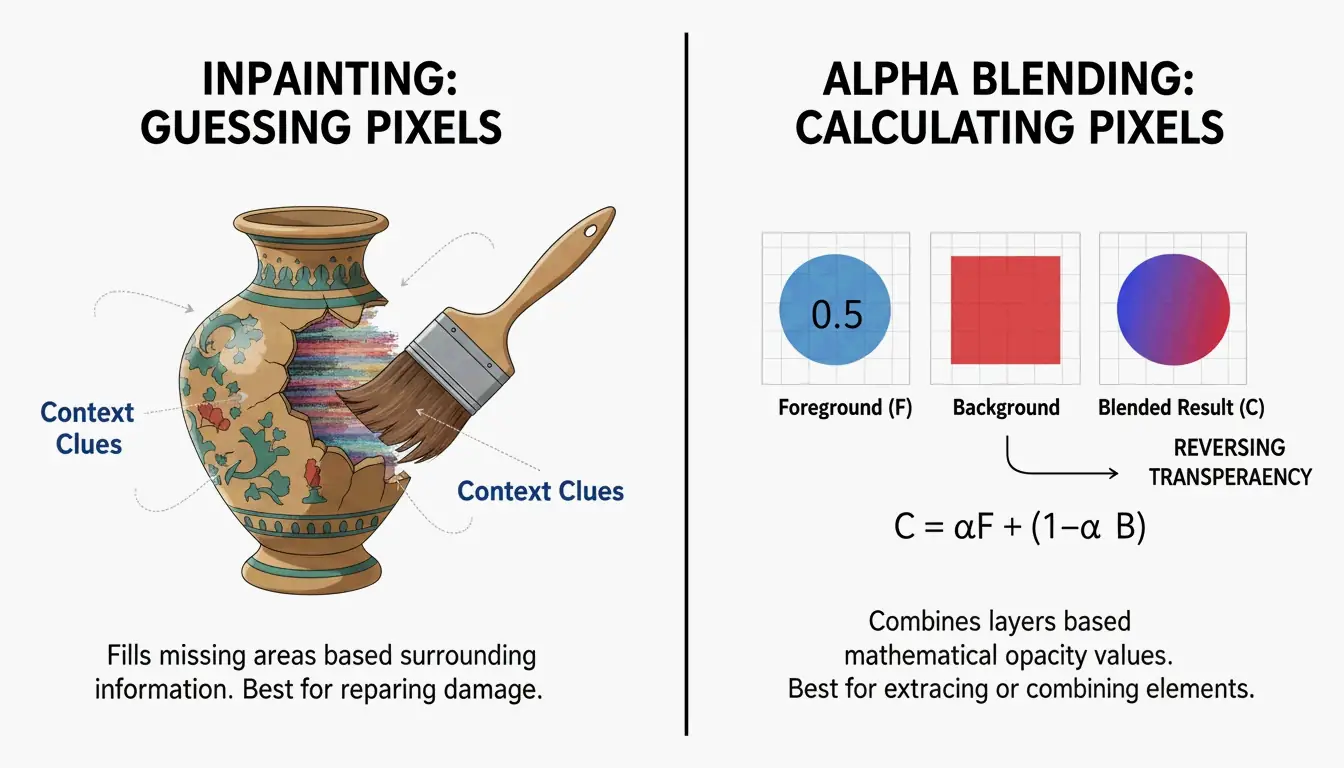
    Generative Inpainting: Reconstructing Missing Pixels

    Generative Inpainting works by analyzing the healthy pixels surrounding a watermark — examining textures, lighting, and patterns — to predict what should be behind the logo. Tools like HitPaw use Content-Aware Fill models to plug the gaps automatically, blending new pixels naturally with the surrounding image.

    Reverse Alpha Blending: Mathematical Pixel Recovery

    Unlike inpainting, Reverse Alpha Blending is a calculation, not a prediction. Most watermarks are applied using the formula: Watermarked = alpha x Logo + (1 - alpha) x Original. If the AI can determine that formula (the alpha map), it reverses the math to recover the original pixels. This is the optimal method for semi-transparent text because it restores actual data rather than painting over it.

    Side-by-side visual comparison of Inpainting (reconstructing) vs. Alpha Blending (mathematical reversal)

    Removing AI-Generated Watermarks: Gemini (Nano Banana) and Meta AI

    By 2026, a new category of challenge has emerged: watermarks generated by AI systems themselves, such as Meta’s “Imagined with AI” label and Google’s “Nano Banana” pattern. These are engineered to be persistent. Standard removal tools often leave behind visible artifacts.

    Research by Allen Kuo produced specialized 48×48 and 96×96 Reverse-Alpha Masks designed for Gemini watermarks. By targeting the exact blending mathematics Google uses, these scripts achieve pixel-perfect cleanup that general-purpose erasers cannot match.

    The “AI vs. AI” Workflow for Synthetic Media

    For professional results on AI-generated images, experts deploy a two-pass workflow. After the initial watermark is removed, a second pass using models like FDnCNN (Fast Deep Convolutional Neural Network) cleans up residual edge artifacts. As Allen Kuo notes, removing SynthID without quality loss is nearly impossible because it is entangled with the entire image. However, for visible labels, GPU-accelerated denoisers effectively eliminate the “sparkle” or blurry edges that basic tools leave behind.

    Best AI Watermark Removers in 2026: Ranked by Performance

    The market splits between accessible web tools and powerful developer scripts. A 2026 test of 15 services by GStory AI found that performance depends heavily on background complexity and watermark opacity.

    Top Free Picks for Quick Web Edits

    Tool Key Strength Format Support Free Tier
    GStory AI Complex area reconstruction JPG, PNG, WEBP 50 free credits
    DeWatermark.ai Multiple watermark handling JPG, PNG Auto 3.0 mode
    Phototune AI No-signup simplicity JPG, PNG (up to 10MB) Free
    Pixelbin Modern format support WEBP, HEIC Auto Mode

    Pro Tools for Batch Processing and High-Resolution Assets

    For bulk work, Batch Processing is essential. PhotoGrid allows processing up to 20 photos simultaneously at no charge. For developers, GitHub tools like the Gemini Watermark Tool can integrate into Claude Code Skills or MCP Servers, enabling AI agents to handle removal automatically within local workflows using FDnCNN for high-resolution output.

    Step-by-Step: How to Use AI to Remove Watermarks Without Quality Loss

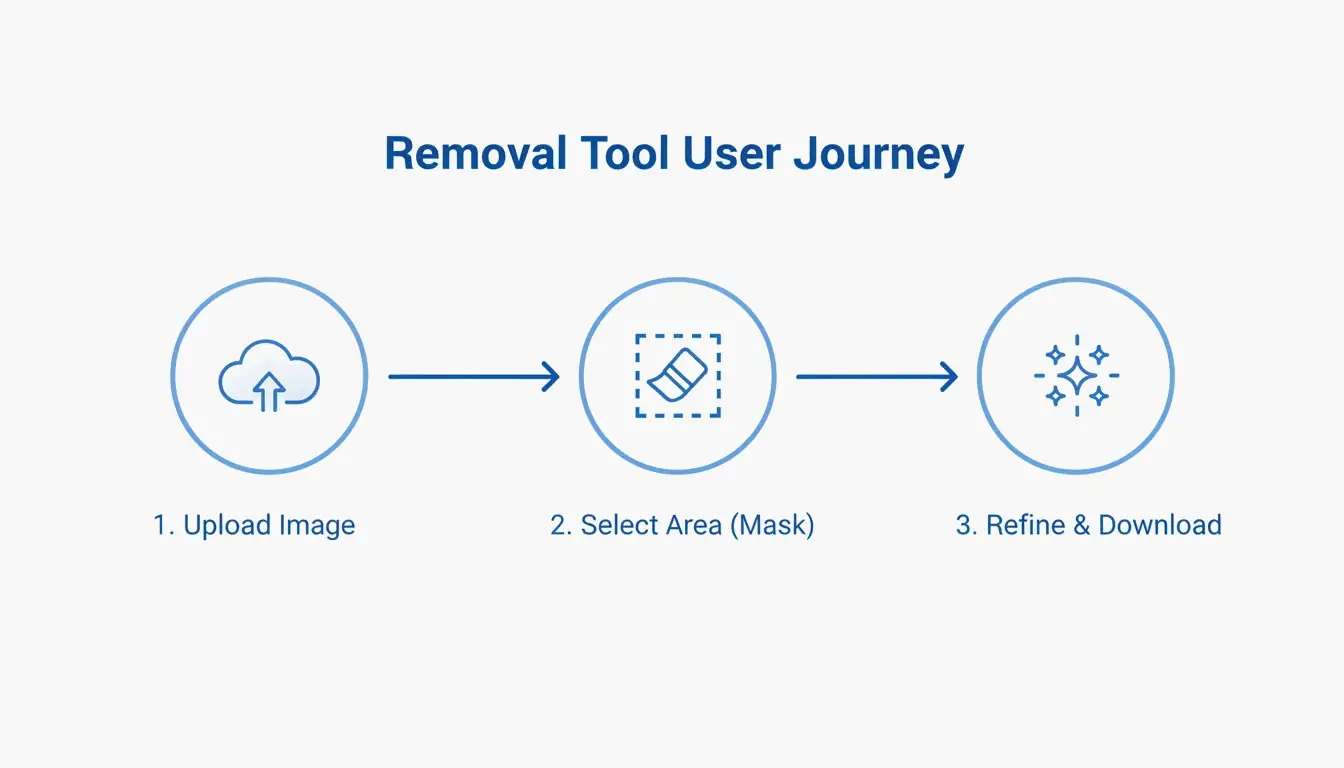
    Most AI tools simplify the process into three stages:

    1. Upload: Select your file (JPG, PNG, or WEBP). Tools like Pixelbin accept files up to 10MB.
    2. Mask Selection: Let “Auto Mode” detect the logo, or use a manual brush to highlight the area.
    3. Refinement: After removal, use a “Magic Brush” or Content-Aware Fill to clean up any spots the AI missed.

    3-step linear flow: Upload then Selection then Refine

    Troubleshooting: What to Do When AI Leaves a Blur

    If a blurry patch remains, the background was likely too complex for the AI to predict accurately. Run a second pass with a denoiser like FDnCNN to smooth out the noise. For final polish, a quick touch-up with a Clone Stamp tool in an editor like Photopea provides professional-grade results.

    Conclusion

    Watermark removal in 2026 has evolved from simple blurring to mathematical precision via Reverse Alpha Blending. Whether handling a standard copyright logo or a stubborn Gemini “Nano Banana” label, current tools are up to the task. For quick fixes, web tools like GStory or Pixelbin are the most accessible options. For photographers and professionals who demand pixel-perfect output, GitHub-based tools and MCP server integrations offer maximum control without the “hallucinations” typical of basic AI erasers.

    FAQ

    Is it legal to remove watermarks from images for personal use?

    Generally, removing a watermark is illegal if it infringes on copyright, as protected under DMCA Section 1202. Exceptions may exist for recovering your own lost assets or for uses that fall under specific fair use provisions. Always verify the original creator’s license before modifying an image.

    Can AI remove invisible watermarks like Google’s SynthID?

    No. While AI can erase the visible pixels of a logo, SynthID is embedded into the image’s structural features. Removing it typically requires degrading the image quality to an unusable state. According to research by Allen Kuo, SynthID remains detectable by specialized safety tools even after visible editing or cropping.

    How to remove watermarks from photos on iPhone or Android without an app?

    Use mobile-optimized web tools like DeWatermark.ai or GStory directly in your mobile browser. Modern mobile browsers support Generative Inpainting APIs for one-click removal. This approach avoids the security risks of downloading “free” apps that may contain malware or excessive advertising.

  • How to Optimize Photos for the Web: The 2026 Performance Guide

    How to Optimize Photos for the Web: The 2026 Performance Guide

    Getting images right is often the fastest way to speed up a website. In 2026, the standard workflow follows three steps: Resize, Compress, and Convert. This process keeps pages competitive at a time when users expect instant loading and Google’s ranking systems reward strong page experience.

    The AVIF format has overtaken WebP as the preferred choice for web images. According to SimpleResizer, AVIF delivers roughly 20% better compression than WebP while maintaining equivalent visual quality, and it is now supported across virtually all modern browsers.

    Step 1: Precise Resizing and Aspect Ratio Scaling

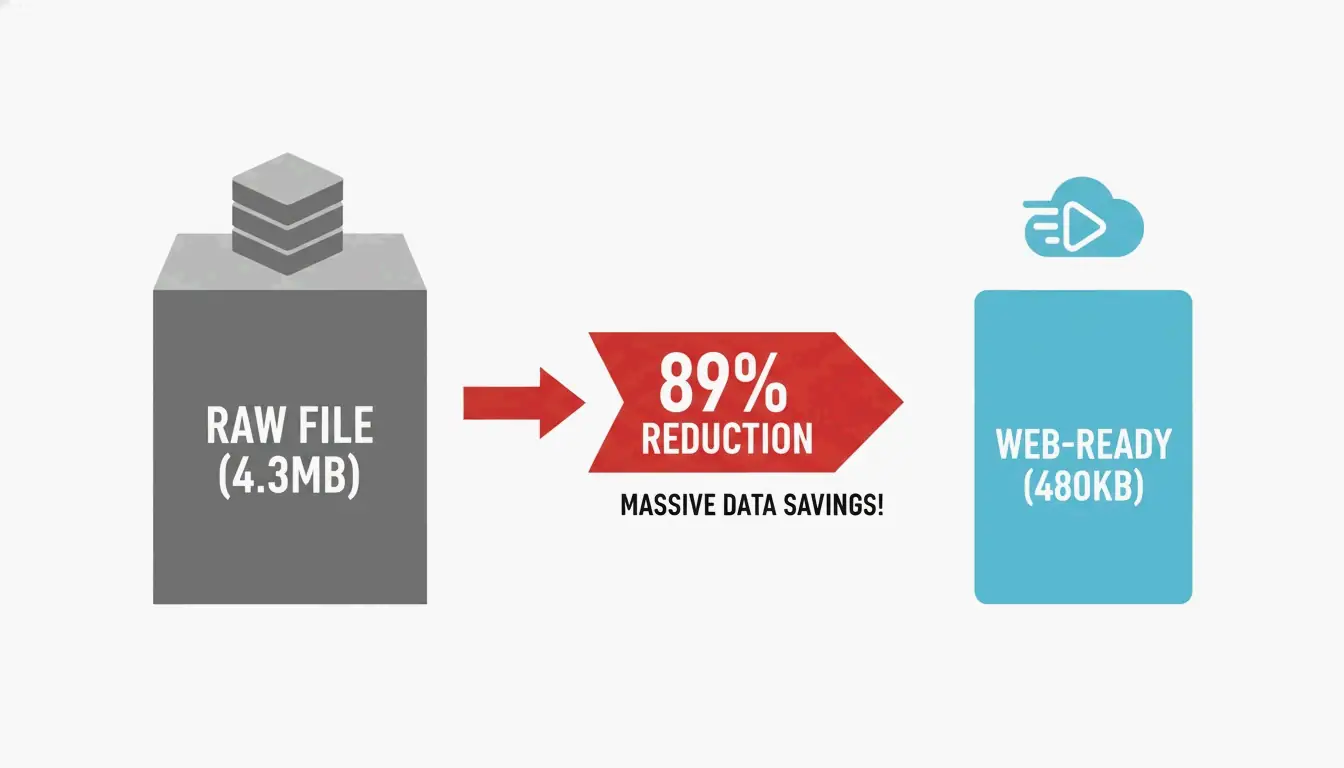
    Serving an image that is significantly larger than its display dimensions is one of the most common performance mistakes. Data from DebugBear shows that resizing a raw 4.3 MB photo to standard web dimensions (such as 1266 x 845 pixels) can cut file weight by 89%.

    Before uploading, check the maximum width of your site’s content area. For most blogs this falls between 800px and 1200px. Tools like Canva or Photoshop can scale images to these exact sizes. For high-density Retina displays, serve a 2x version (for example, 2400px for a 1200px container) using responsive markup, but never upload a raw 6000px+ file directly from a camera.

    A comparison showing file size reduction from a raw photo to a resized web-ready image.

    Step 2: Choosing Between Lossy and Lossless Compression

    Compression removes data that a file does not need. In 2026, developers generally choose between two methods:

    Compression Type How It Works Best Use Case Typical Quality Setting
    Lossy Discards some visual data to minimize file size Photos, blog images, product shots 75% – 82%
    Lossless Retains all original data pixel-for-pixel Logos, technical diagrams, icons 100%

    As purshoLOGY notes, lossy compression should be the default for photographic content to keep sites fast. Reserve lossless formats like PNG for situations that specifically require transparency or simple line graphics.

    Step 3: Format Selection — AVIF, WebP, or JPEG

    The format you choose has a direct impact on both file size and browser compatibility.

    Format Compression vs. JPEG Browser Support (2026) Best Role
    AVIF ~50% smaller Universal Primary format
    WebP ~30% smaller Universal Fallback
    JPEG Baseline Universal Legacy fallback

    Impact on Core Web Vitals: LCP and CLS

    Images directly affect search rankings. According to SimpleResizer, 70% of web pages feature an image as their Largest Contentful Paint (LCP) element — the largest visible block when the page loads. A heavy hero image drags down LCP scores, and rankings can follow.

    Cumulative Layout Shift (CLS) is equally important. It occurs when a browser cannot determine an image’s dimensions before loading, causing text to reflow once the image appears. Always include width and height attributes so the browser reserves space immediately.

    The fetchpriority=”high” Attribute

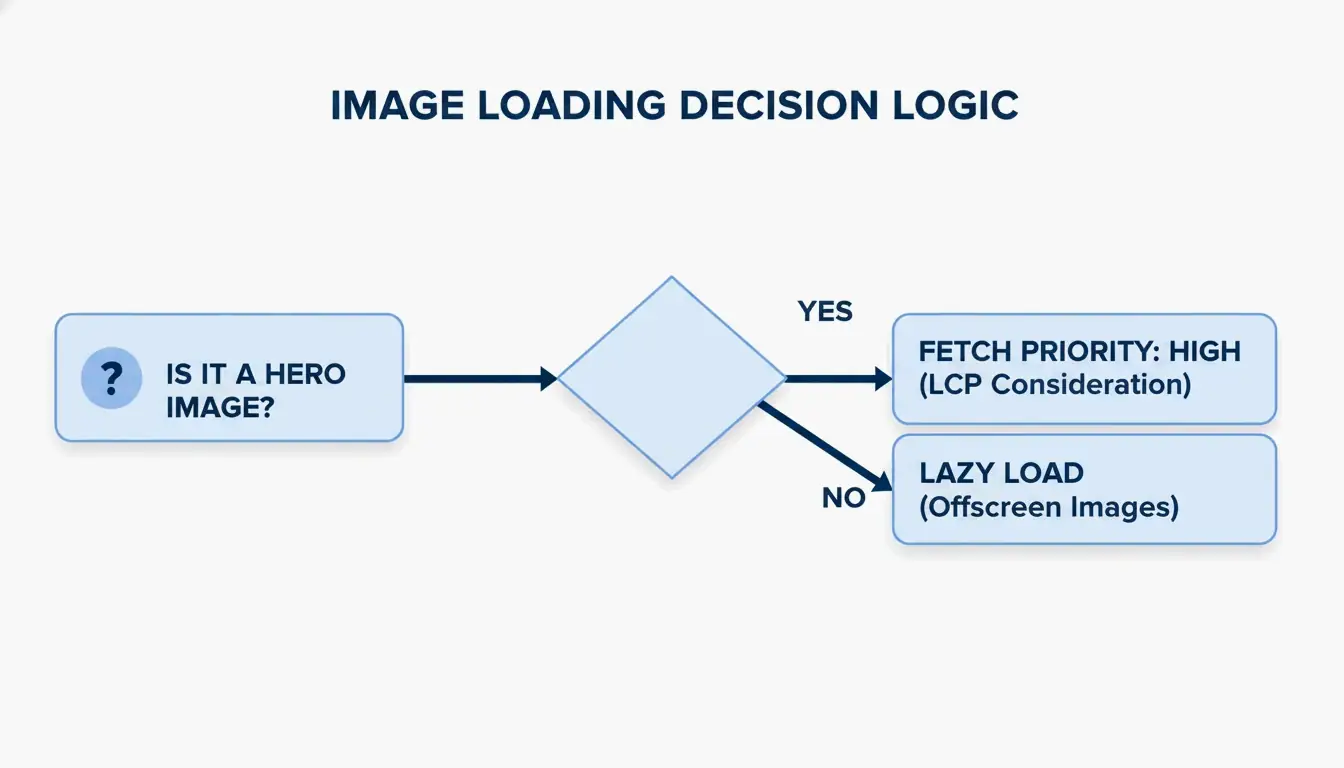
    A common mistake is “over-optimizing” by lazy loading every image. While loading="lazy" benefits below-the-fold content, applying it to the hero image (the LCP element) actively slows things down.

    The 2026 best practice: remove lazy loading from above-the-fold images and add fetchpriority="high" instead. This signals the browser to prioritize that specific image ahead of less critical scripts or styles.

    A 3-step decision flow for image loading strategy: above-the-fold vs. below-the-fold.

    Modern Delivery: CDN Implementation and Responsive Code

    Even a small image feels slow when it has to travel across continents. A Content Delivery Network (CDN) such as Cloudflare or BunnyCDN stores copies of images on servers geographically closer to visitors.

    EXIF metadata — GPS coordinates, camera settings, and other hidden data embedded in smartphone photos — should also be stripped. This saves 2% to 10% on file size and protects the privacy of whoever took the photo.

    Code Snippet: The Optimal Image Tag with Fallbacks

    Use the picture element to serve AVIF to modern browsers while maintaining a fallback chain for older clients:

    picture
      source type image/avif srcset photo.avif
      source type image/webp srcset photo.webp
      img src photo.jpg width 1200 height 675 alt "Descriptive alt text" loading lazy decoding async
    

    A GIMP test demonstrated that shrinking a JPEG from 1072 KB to 384 KB (a 64% reduction) using techniques like Chroma subsampling (4:2:0) produces significant gains without any perceptible quality loss.

    Top Tools for Automated Image Optimization

    Tool Type Strength Best For
    Squoosh Manual / Free Full control over AVIF and WebP settings One-off compression
    TinyPNG Manual / Free Fast batch shrinking Quick bulk jobs
    Imagify Automated / Paid Scans entire library, converts to AVIF, serves via CDN WordPress sites
    EWWW Image Optimizer Automated / Paid Full-pipeline automation with CDN E-commerce stores

    As SimpleResizer points out, Google Images can account for 20-30% of all search traffic for online stores, making automated optimization a measurable revenue driver.

    Conclusion

    Optimizing photos for the web in 2026 means managing three levers: format selection (AVIF primary, with fallbacks), delivery infrastructure (CDN), and browser priority hints (fetchpriority). A fast site is no longer optional — it is a requirement for retaining users and ranking well in search.

    Action Step: Run your site through PageSpeed Insights to identify LCP bottlenecks. Then set up an automated AVIF pipeline with JPEG fallbacks to keep your site fast and accessible on every device.

    FAQ

    Does optimizing images affect their visual quality on Retina displays?

    High-density displays need 2x or 3x resolution to look sharp. Use the srcset attribute to send high-resolution versions only to devices that can display them. Modern formats like AVIF preserve significantly more detail at these resolutions than older JPEG files, even at substantially smaller file sizes.

    Should I use AVIF or WebP as my default image format in 2026?

    AVIF is the better choice for most use cases. It offers approximately 20% better compression than WebP at the same quality level, and nearly all current browsers support it. However, always include a WebP or JPEG fallback using a picture element so the site remains functional for visitors on older browsers or devices.

    How do I fix the “Largest Contentful Paint image was lazily loaded” error?

    Identify the hero image — typically the large banner or product photo at the top of the page. Remove the loading="lazy" attribute from that specific img tag, because lazy loading instructs the browser to defer loading. Instead, add fetchpriority="high" to tell the browser to fetch that image immediately.

    Is it safe to strip EXIF metadata from all website photos?

    Yes, and it is recommended. Stripping EXIF data typically saves between 2% and 10% of file size. It also protects privacy by removing GPS coordinates and other sensitive information. The only exception is when your industry requires copyright or author metadata for legal compliance.

  • Optimizing Photos for Website Performance: The 2026 Technical Guide

    Optimizing Photos for Website Performance: The 2026 Technical Guide

    Optimizing photos for your website in 2026 requires prioritizing modern formats like AVIF and WebP, resizing dimensions for responsive displays, and applying lossy compression. By implementing lazy loading, descriptive alt text, and CDNs, you significantly improve Core Web Vitals (LCP) and visibility in both traditional and AI-driven search engines.

    The 2026 Framework for Optimizing Photos for Website Speed

    Image weight remains the biggest hurdle for web performance. According to NeedleCode, images make up over 60% of the total weight of a typical webpage. This directly impacts your Core Web Vitals, specifically the Largest Contentful Paint (LCP) — the metric that tracks how fast your main content appears. Data from SimpleResizer shows that images trigger the LCP on 70% of pages, meaning search rankings are essentially tied to photo loading speeds.

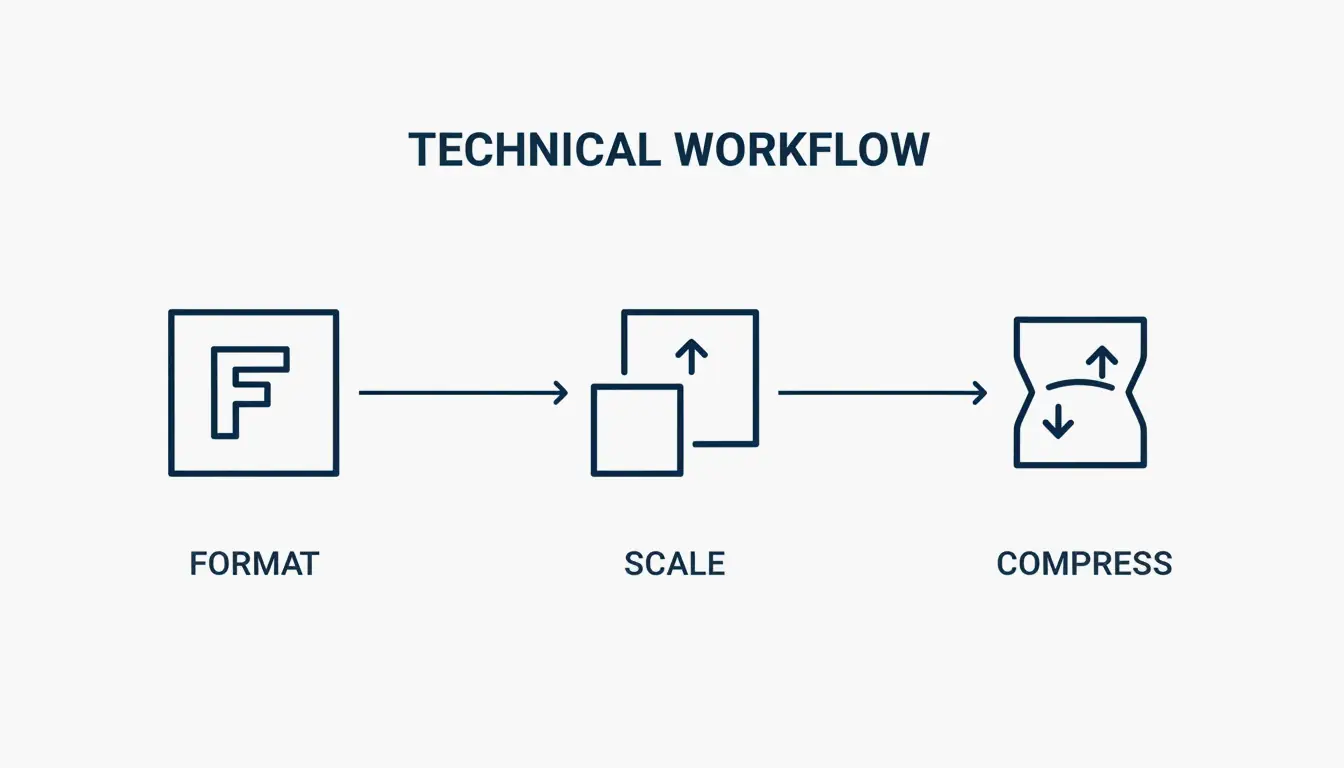
    Follow this three-step optimization order: Format, Scale, Compress. Start by choosing a modern file type, resize the image to the exact size it will appear on screen, and finally use a compression algorithm to trim unnecessary data.

    The 3-step optimization workflow: Format, Scale, Compress

    Auditing Your Current Performance with DebugBear

    Before making changes, establish a baseline. Tools like DebugBear let you track “Page Weight (Images)” as a specific metric to find pages where heavy media is slowing things down. Set a Performance Budget — for example, an alert if a key page exceeds 600KB in image weight.

    Choosing the Right Format: Why AVIF Is the 2026 Standard

    Format selection is the easiest path to big performance gains. JPEG is mostly phased out in professional web development.

    Format Compression Browser Support Best Use Case
    AVIF Best (smallest files at equal quality) All modern browsers Hero images, high-quality photography
    WebP High (25-35% smaller than JPEG) All modern browsers General site images, reliable default
    PNG Low (lossless, larger files) Universal Flat graphics, logos, transparent backgrounds
    SVG Code-based (resolution-independent) All browsers Icons, simple logos

    An often-overlooked step is stripping EXIF Data. Every camera photo hides metadata like GPS coordinates and timestamps. SimpleResizer notes that removing this data shrinks the file and protects privacy without changing the photo’s appearance. A WordPress Support case study found that exporting a JPEG via GIMP at Quality 60 (with 4:2:0 subsampling) cuts file size by 64% with almost no visible difference.

    Developer Cheat Sheet: Implementing AVIF with WebP Fallbacks

    To use the newest formats without leaving older browsers behind, implement the HTML picture element pattern. This lets the browser select the best format it supports:

    1. Set a source element with type “image/avif” pointing to your AVIF file
    2. Set a source element with type “image/webp” pointing to your WebP file
    3. Set a fallback img element pointing to your JPEG, with loading=”lazy” and descriptive alt text

    This progressive approach ensures every visitor gets the best format their browser supports.

    Technical Implementation: Resizing and Responsive Delivery

    A common mistake is uploading a 4000px wide photo into a 1200px display space. If your content area is 600px wide, WordPress Support recommends serving an image about 1.5 to 2 times that width (1200px). This keeps the image sharp on high-resolution Retina screens without wasting bandwidth.

    Display Width Recommended Image Width Reason
    400px 800px 2x for Retina
    600px 1200px 2x for Retina
    800px 1200px 1.5x (balance of quality and size)

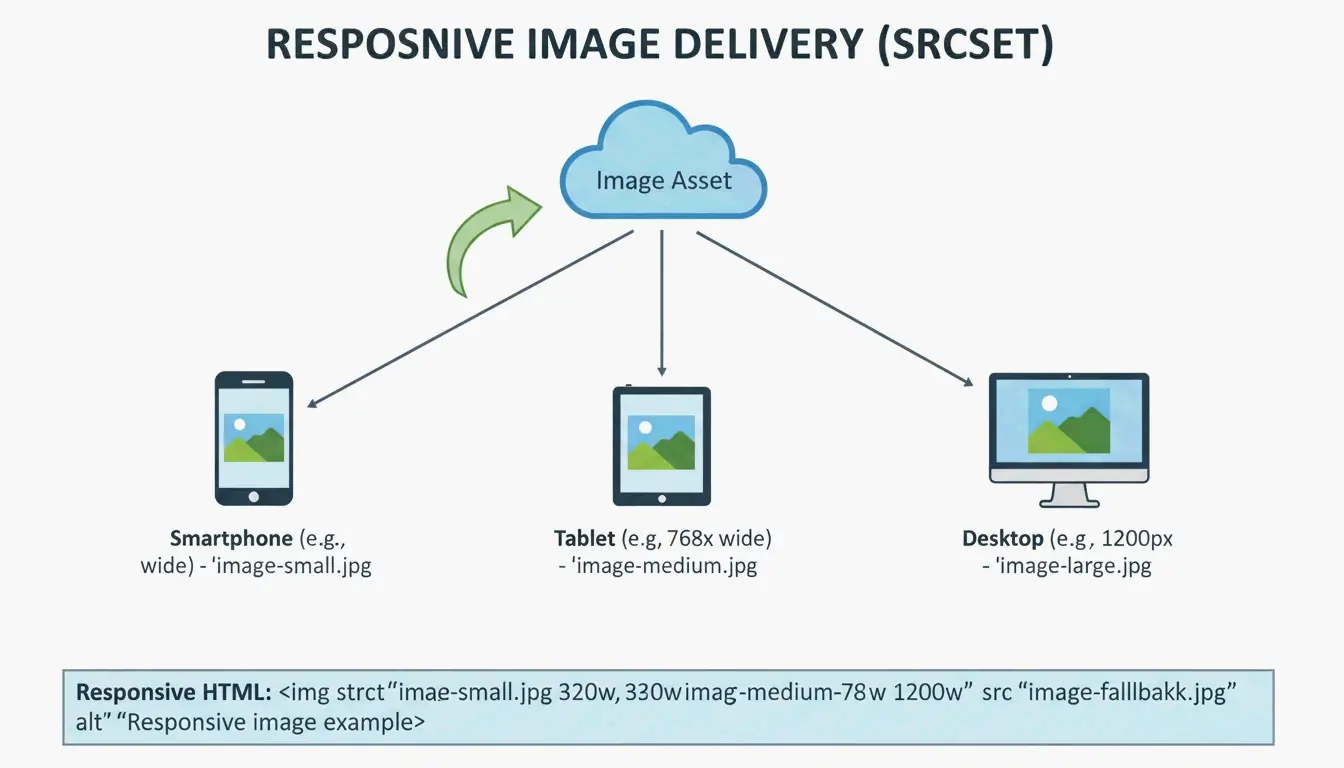
    Use the srcset attribute to offer multiple sizes. This way, a phone does not download a desktop-sized image. For manual optimization, Squoosh and TinyPNG are the go-to tools. DebugBear reports that resizing a standard Pexels image from 7108px to 1266px slashes file size by 89%.

    Responsive image delivery: serving different sizes to different devices

    The Role of a CDN in Global Image Delivery

    Even a perfectly optimized image will feel slow if it travels halfway around the world. A Content Delivery Network (CDN) like Cloudflare or BunnyCDN keeps copies of your images on edge servers closer to users. Many modern CDNs handle format conversion and resizing automatically based on the user’s device.

    Future-Proofing for GEO: Image SEO in the AI Era

    In 2026, photo optimization is about more than speed — it is about Generative Engine Optimization (GEO). AI search tools and visual search like Google Lens need to “read” your images to understand your content. Statistics from SimpleResizer show that 20-30% of all e-commerce traffic now comes from Google Images and visual discovery tools.

    Follow these steps for AI-ready images:

    Step Action Example
    Filenames Use descriptive names red-leather-armchair.webp (not IMG_4837.jpg)
    Alt Text Write factual descriptions “Barista pouring milk into a latte to form a tulip pattern”
    Placement Keep images near related text Helps crawlers understand context

    Lazy Loading: Improving UX and Initial Paint

    Native lazy loading should be used for any image below the fold. Adding loading="lazy" tells the browser to wait before downloading those images, saving data and speeding up the Critical Rendering Path. Important: never lazy load your top hero image. That image is your LCP, and delaying it will hurt your SEO.

    Conclusion

    Modern image optimization balances visual quality with performance. Clicking “Save for Web” is no longer sufficient. You need next-gen formats like AVIF, responsive srcset delivery, and AI-ready alt text.

    To stay ahead in 2026, audit your site with PageSpeed Insights or DebugBear, move toward AVIF as your default format, automate compression where possible, and ensure every image has a clear reason for being on the page. This boosts Core Web Vitals and ensures visibility in the era of visual search.

    FAQ

    Does image optimization affect my Core Web Vitals (LCP/CLS) scores?

    Yes. Images are the primary driver of Largest Contentful Paint (LCP), which measures how fast main content loads. Providing explicit width and height attributes prevents Cumulative Layout Shift (CLS) by allowing the browser to reserve space before the image downloads, ensuring a stable visual experience.

    Should I use a WordPress plugin or optimize images manually before uploading?

    Manual optimization using tools like Squoosh offers the highest quality control and is ideal for critical assets like hero banners. For high-volume sites or blogs, WordPress plugins like Smush, Imagify, or EWWW Image Optimizer are better for bulk automation, ensuring every uploaded image is resized and compressed consistently.

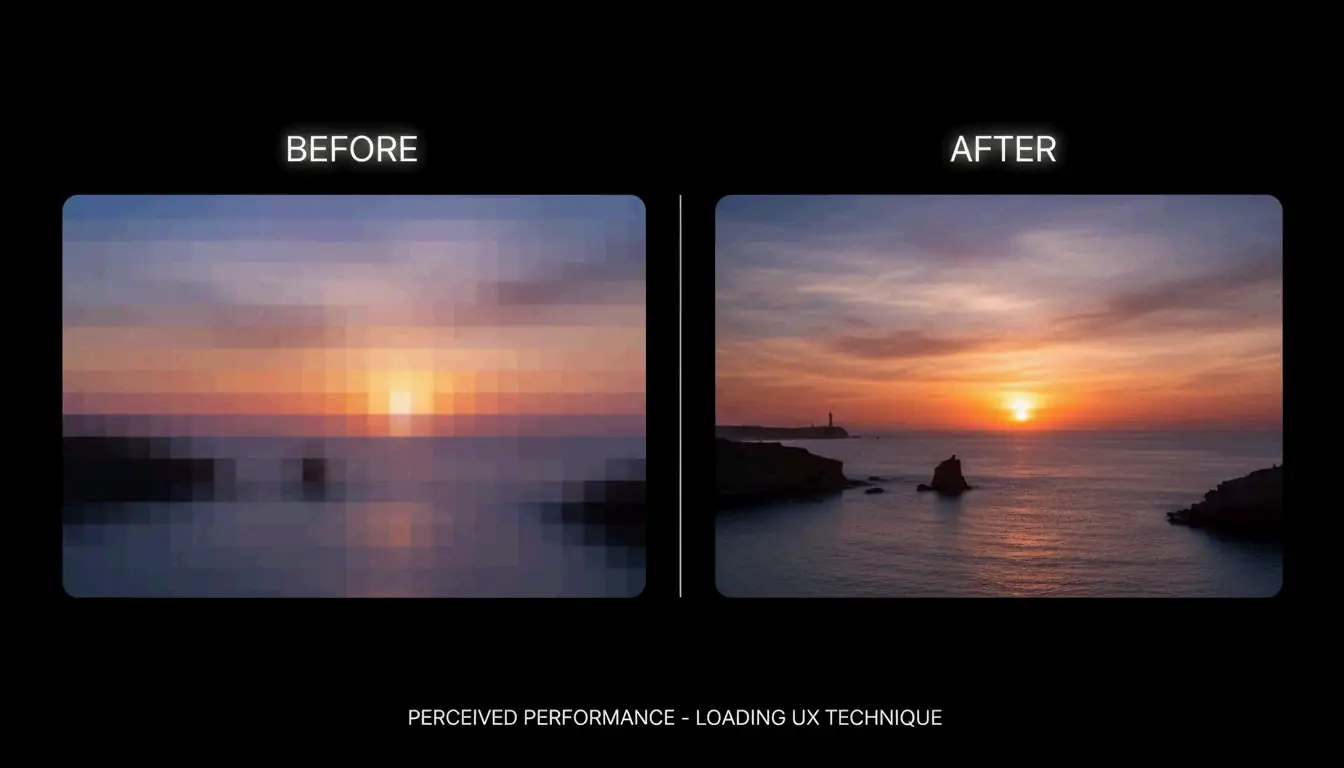
    What is the blur-up technique and how does it improve user perception?

    The “blur-up” technique loads a tiny, low-resolution placeholder (often 10-20 pixels wide) that is stretched and blurred to fit the image container. As the high-resolution version downloads in the background, it replaces the placeholder. This improves perceived speed by giving users a visual hint immediately, reducing bounce rates.

    Comparison of blur-up vs standard loading